


Sigachi Industries Ltd
PE dropping while EPS on the rise!

Here at EquityEdge Research, we make Small-Cap Investing easy for you by Backing you up with Robust & Full-Fledged Research.
Please Fill the form Below if you are interested in our Services and would like a Free Sample of our Equity Research Report covering a Small/Micro-cap Company.
Read our Previous Report here:

Let’s go!
1. Key Highlights:
MCC Business Expansion: The Microcrystalline Cellulose (MCC) business grew 35.75% to INR 409 crores in FY25, with new capacity reaching 68% utilization and expected to hit near full capacity by FY26.
Strategic Entry into API: The Active Pharmaceutical Ingredients (API) business contributed INR 29 crores in FY25, with the company securing one CEP certification (for Metformin HCL) and targeting 25%+ EBITDA margins as it expands into regulated markets.
New CCS Facility: Environmental clearance has been received for the Croscarmellose Sodium (CCS) facility at Dahej-2 SEZ, with commissioning expected by October 2026 and an estimated capex of INR 90 crores.
Growing O&M Segment: The Operations & Maintenance (O&M) service business showed a 17.66% growth in FY25, contributing INR 41 crores, and is projected for significant growth in FY26, targeting around INR 75 crores.
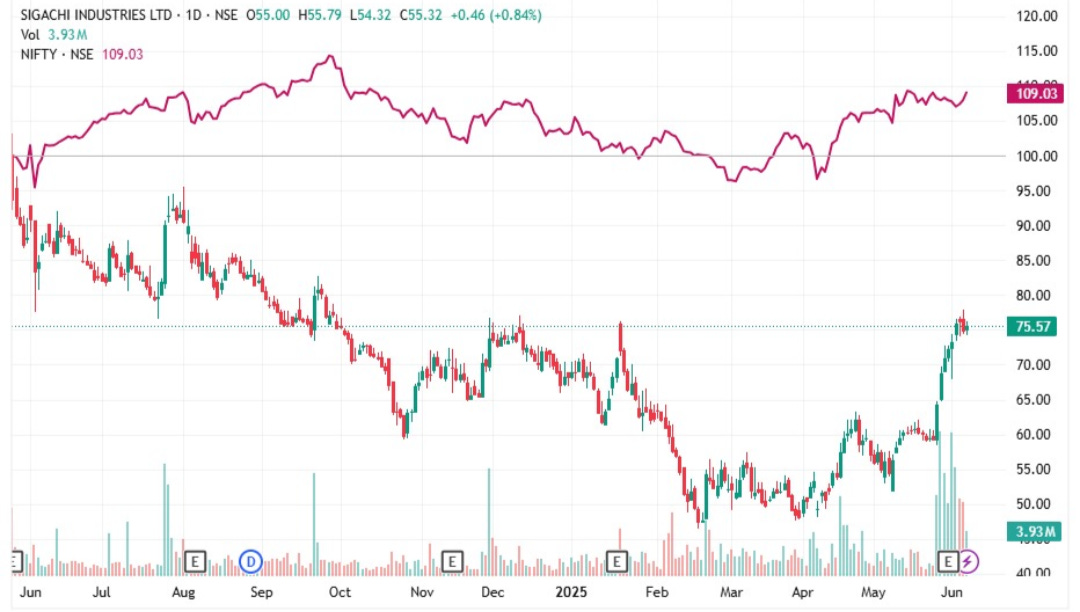
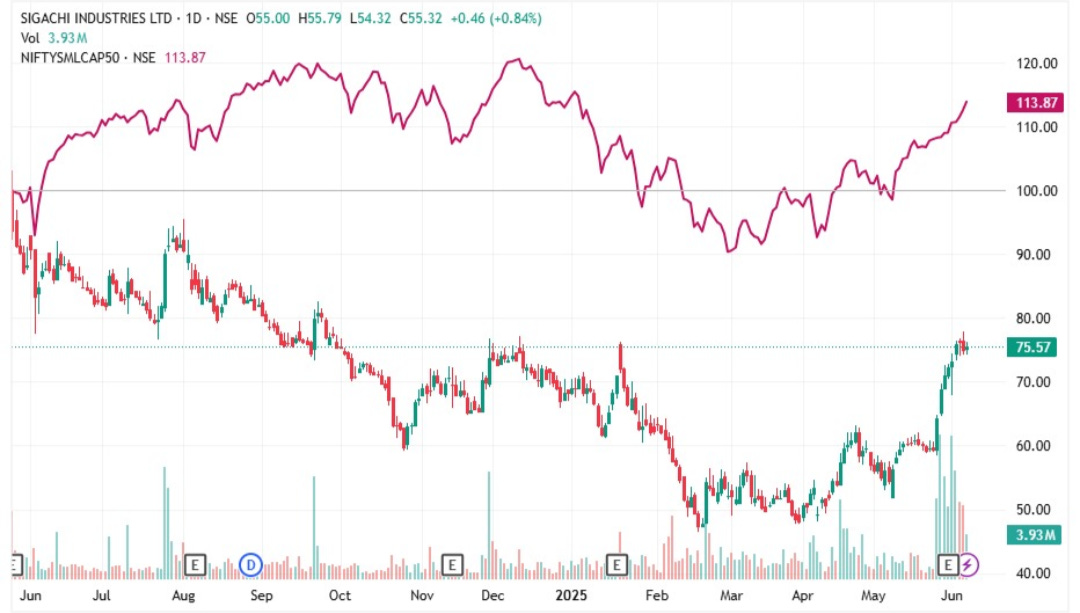
2. Company Chart Analysis:
*Comparison charts are Indexed*
Sigachi Industries Limited Performance

Sigachi Industries Limited Vs. NSE Nifty
Sigachi Industries Limited Vs. NSE Smallcap
3. About the Company:
Sigachi Industries Ltd is a Hyderabad-based company and one of the world’s largest manufacturers of Microcrystalline Cellulose (MCC), a key pharmaceutical excipient. Established in 1989, the company serves pharmaceutical, nutraceutical, food, and cosmetic industries, with a strong global presence and multiple manufacturing facilities across India.
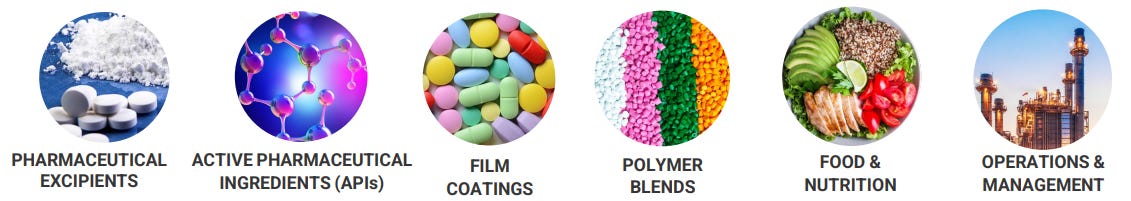
🧪 Business Segments
Pharmaceutical Excipients
Core business segment (MCC & other excipients).
59+ grades of MCC used as binders, fillers, disintegrants, etc.
Customers include global pharma companies.
Annual production capacity: ~11,880 MT.
Active Pharmaceutical Ingredients (APIs)
Newer vertical (2024 acquisition of Trimax Bio Sciences Pvt Ltd).
Focus on manufacturing and marketing of APIs.
Nutrition & Food Ingredients
Supplies food-grade excipients and stabilizers.
Applications in functional foods, beverages, and nutraceuticals.
Personal Care & Cosmetics
Offers cosmetic-grade ingredients and additives.
Applications in skincare, haircare, and hygiene products.
PRODUCT AND SERVICE OFFERINGS:
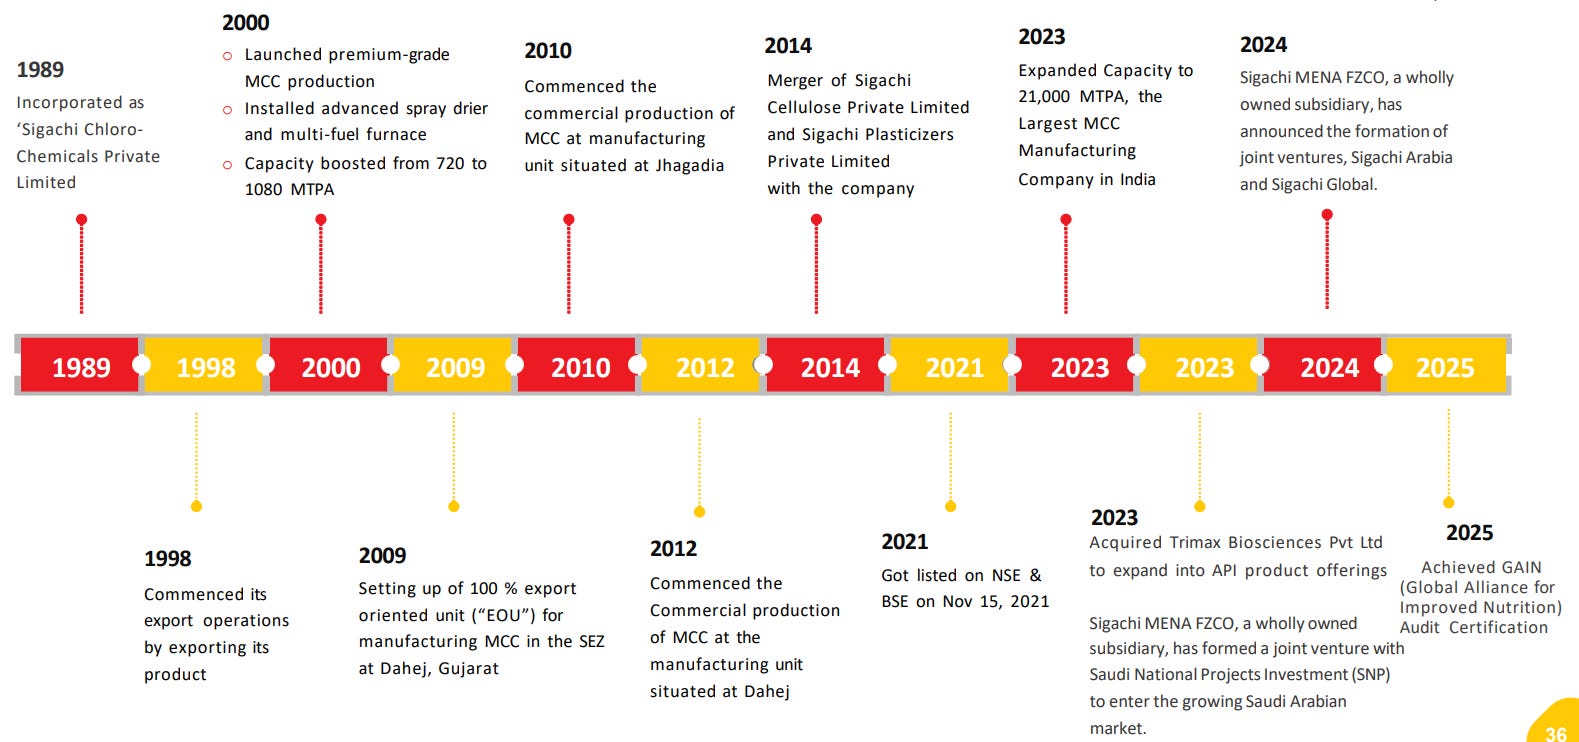
COMPANY JOURNEY:
Present Across the Pharma Ecosystem

Advanced Manufacturing Facilities

Capacity Utilization
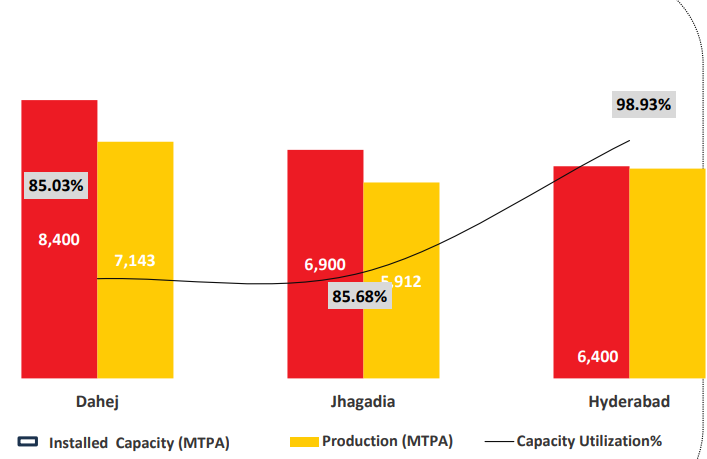
The capacity (7,200 MTPA) added in Q4FY24 resulted in an increase to total capacity of 21,700 MTPA.
Leading MCC Manufacturer in India.
Operating at a combined capacity of 21,700 MTPA across 3 strategic locations.
Expanded capacity has achieved 68% utilization in FY25.
Expanded Capacities are expected to be fully utilized by FY 27.
Investment in Intellectual Properties: R&D (In Rs. Mn)

Trademark- 46
Patent Filed- 7
CEP - 4
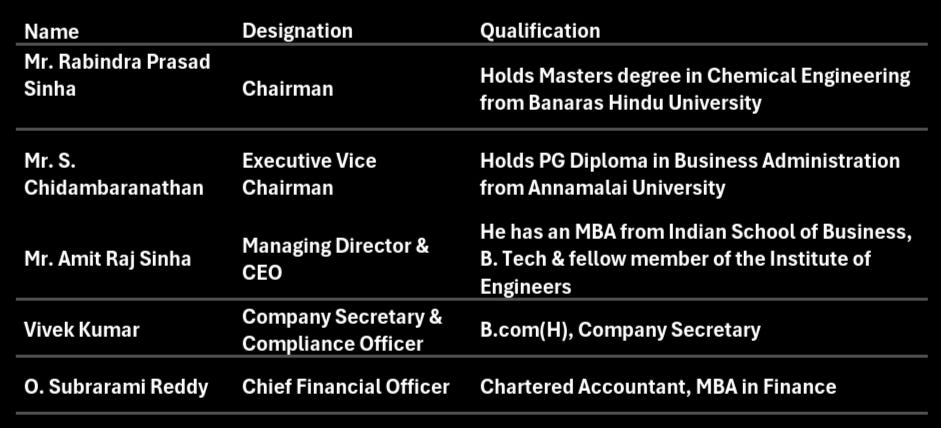
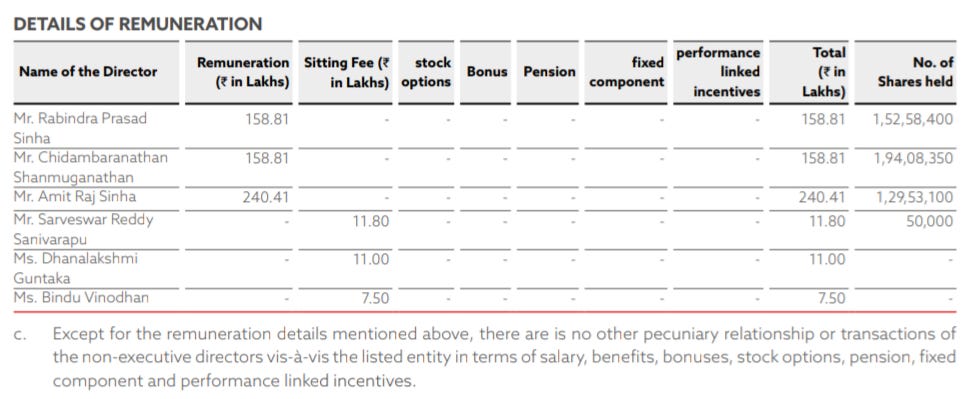
4. Management Overview
KMP's Remuneration
We are Proud to Announce Our New Launch of the Premium services where we Deep-dive into the Business and back you up with Robust Research.
We Provide services for different Level of Investors. You can Email us directly to start your journey!

5. Revenue Breakdown:
Business Segments:
1. Microcrystalline Cellulose (MCC)
The company is India’s leading MCC manufacturer, producing 60+ grades (15–250 microns) under brands like Hi Cel, AceCel, and CoatCel. Its MCC is used in pharmaceuticals (75%), food & nutraceuticals (20%), and cosmetics (5%). The company also offers specialized MCC blends with additives like colloidal silicon dioxide. Between FY20–FY24, revenue grew 138%, driven by 61% volume growth and 48% price increases.
2. Operations & Management
The company provides plant operations and maintenance services for specialty chemicals, petrochemicals, water treatment, and pharma facilities. It works with major clients like Gujarat Alkalies, Aditya Birla Group, ONGC, and Adani Enterprises. This segment saw 219% revenue growth from FY20–FY24.
3. Active Pharmaceutical Ingredients (API)
In August 2023, the company entered the API market by acquiring an 80% stake in Trimax Bio Sciences for ₹100 crore. This move expands its presence in high-value pharmaceutical ingredients.
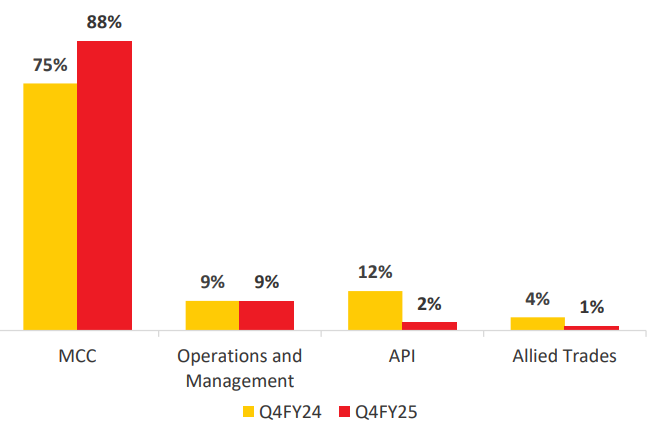
Revenue Contribution % (Q4FY25)
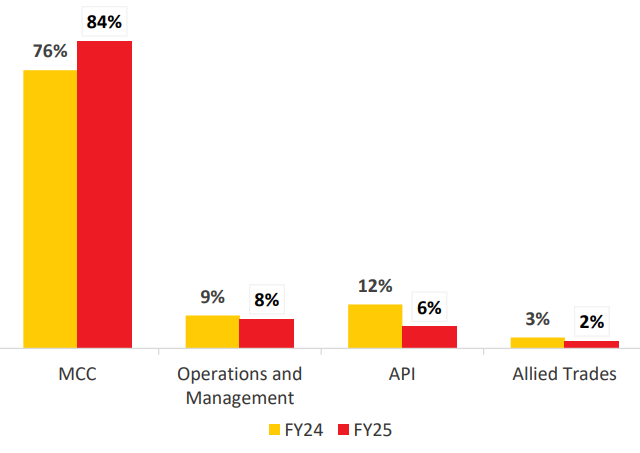
Revenue Contribution % (FY25)
6. Company’s Financial Analysis:
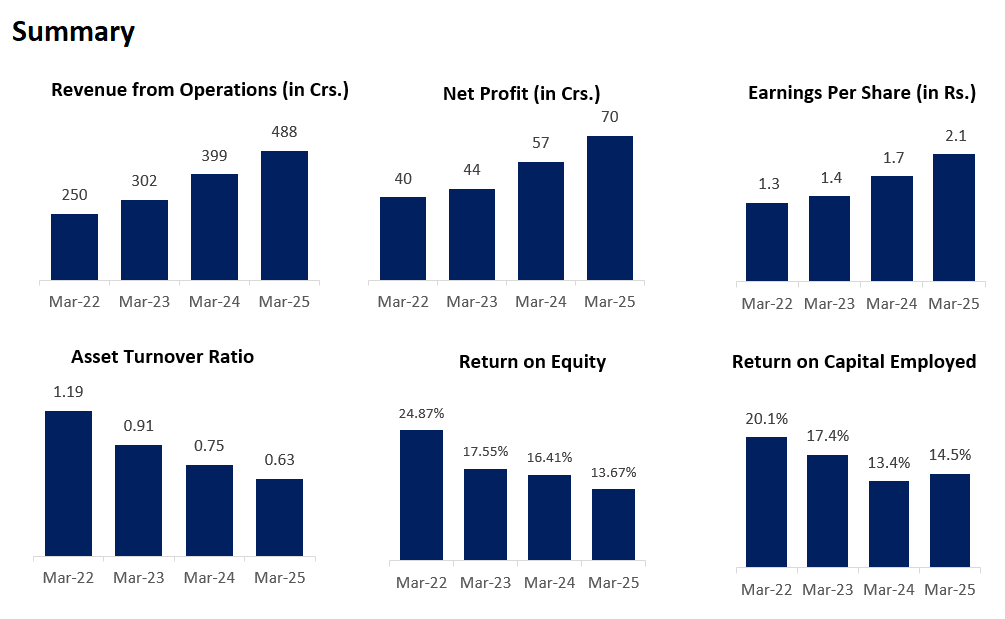
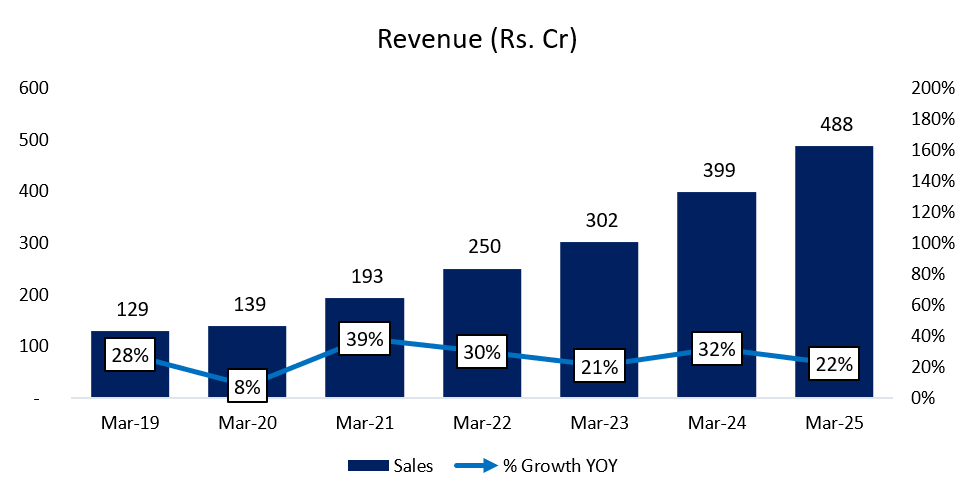
6.1 REVENUE:
Revenue has grown at a CAGR of ~25% in the past 6 years.
Why is it Growing so fast?
FY24 (2023-24):
Capacity Expansion: Increased MCC production capacity by 7,200 metric tons (total: 21,000 MTPA).
Volume Growth: MCC volumes rose 16.47% YoY (12,655 to 14,740 tons).
Revenue Growth: MCC revenue up 15.83% YoY (₹260.3Cr to ₹301.5Cr).
API Acquisition: Acquired 80% stake in Trimax Bio Sciences, adding API segment (₹45Cr revenue in partial year).
O&M Growth: Revenue from O&M grew 32.45% YoY (₹26.5Cr to ₹35.1Cr).
FY25 (2024-25):
Higher Utilization: New MCC capacity reached 68% utilization (target: 80% by FY26).
Revenue Surge: MCC revenue grew 35.75% YoY (₹302Cr to ₹409Cr).
API Progress: Secured CEP certification for Metformin HCL (regulated markets); API revenue at ₹29Cr.
O&M Stability: Added Adani Solar as client; revenue up 17.66% YoY (₹35Cr to ₹41Cr).
Margin Improvement: EBITDA margins rose to 22.38% (vs. 19.2% in FY24).
6.2 GROSS PROFIT:
Gross profit has increased at a CAGR of ~27% for the past 6 years. The margin has improved on account of a significant drop in the cost of raw materials.

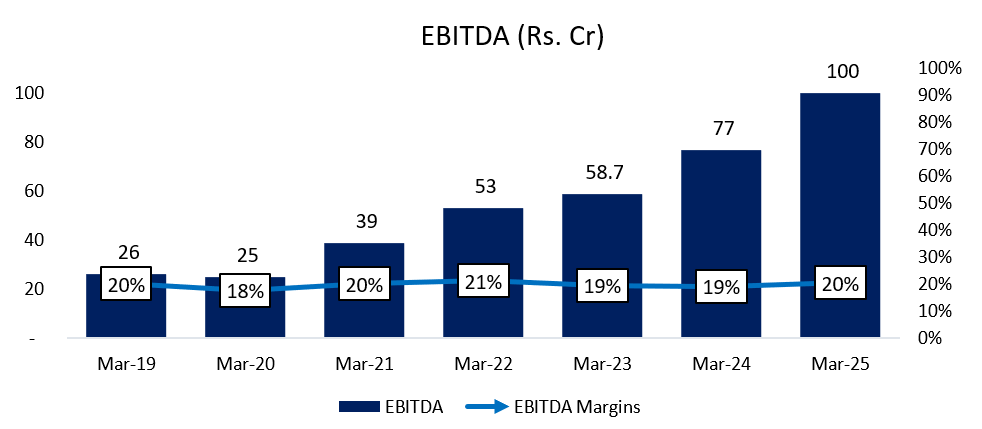
6.3 EBITDA:
EBITDA has increased at a CAGR of ~25% for the past 6 years. The margin is fairly stable. The positive from the fall in material costs has been absorbed by the increase in employee costs primarily.
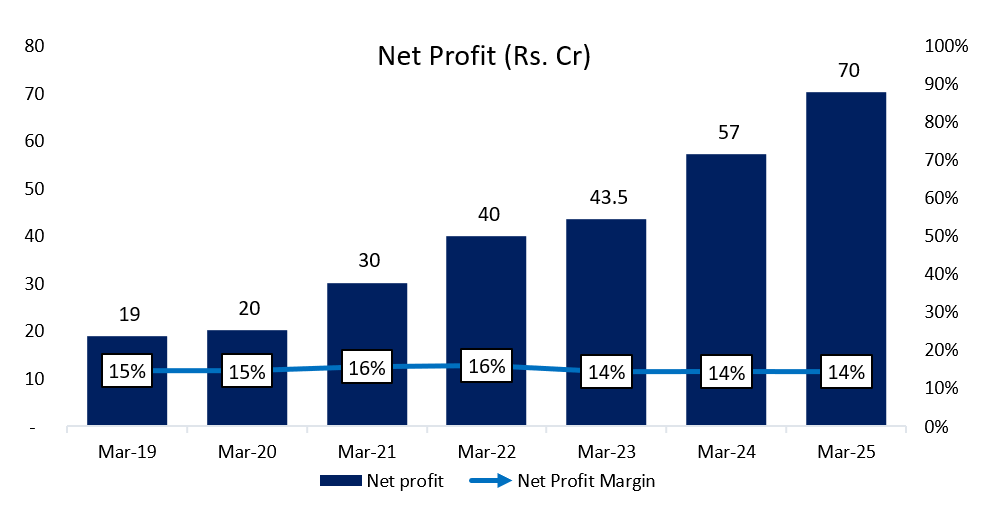
6.4 Net Profit:
Net profits have continuously increased at a CAGR of ~24% for the past 6 years. The margin is stable at mid-teens.
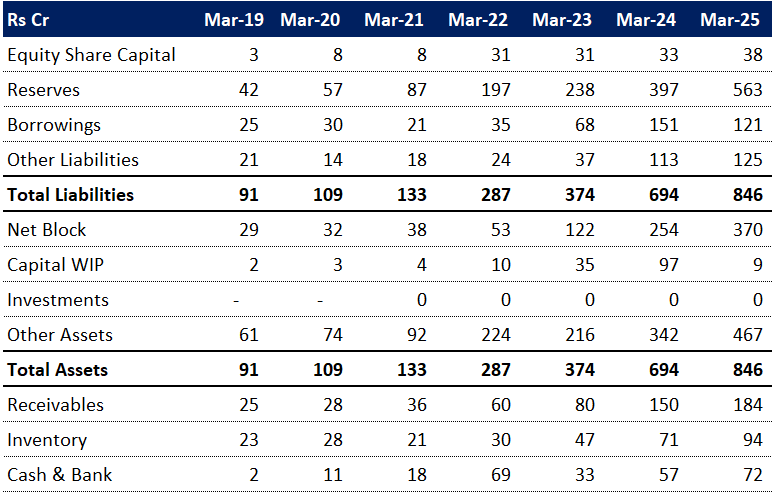
6.5 Balance Sheet:
Strong Growth in Reserves, Low Reliance on Borrowings:
Reserves have steadily grown from 45.7% in Mar-19 to 66.5% in Mar-25, indicating internal accrual-driven strengthening. Borrowings declined from 27.5% to 14.2% over the same period, suggesting reduced leverage and a healthier balance sheet.Significant Shift Toward Fixed Assets:
Net Block has jumped from 31.2% in Mar-19 to 43.8% in Mar-25, with a spike post FY23, reflecting increased investment in tangible assets. Capital Work in Progress also peaked in FY24 (14%) before dropping sharply in FY25 (1%), hinting at major project completions.Asset Composition Stabilizing After Volatility:
Cash & Bank holdings peaked in Mar-22 at 24.2% but normalized to 8.5% by Mar-25. Inventory and receivables show a more stable trend recently, suggesting improved working capital management and liquidity normalization.
6.6 Common-Size Balance Sheet:

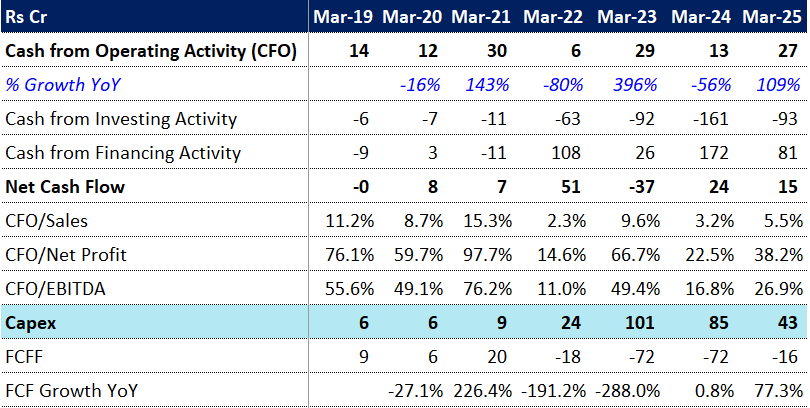
6.7 Cashflow Analysis:
Volatile Operating Cash Flow Reflects Inconsistent Core Performance:
CFO has fluctuated sharply—from ₹14 Cr in FY19 to a low of ₹6 Cr in FY22, peaking at ₹30 Cr in FY21. The erratic YoY growth (ranging from -80% to +396%) and low CFO/Sales ratios (mostly below 10%) indicate inconsistent cash generation from core operations.Heavy Capex in FY23–24 Hurt Free Cash Flow (FCFF):
Capex surged to ₹101 Cr in FY23 and ₹85 Cr in FY24, which severely dented FCFF, pushing it into deep negative territory (–₹72 Cr both years). Despite a moderate CFO recovery in FY25, high prior investments continued to suppress FCFF to –₹16 Cr.Improved CFO Efficiency in FY25 but Still Room for Growth:
FY25 saw better CFO/Net Profit (38.2%) and CFO/EBITDA (26.9%) ratios compared to FY24, signaling efficiency gains. However, the metrics are still below FY21 levels, and sustainability of this recovery remains a key watchpoint amid reduced capex.
6.8 Cash Conversion Cycle:
Sharp Deterioration in Working Capital Efficiency Post FY21:
After improving to 116 days in FY21, the CCC worsened to 233 days by FY25, mainly due to a surge in Debtor Days (from 68 to 137) and Inventory Days (from 77 to 155), implying slower collections and stock turnover.Payables Support Peaked in FY24, But Not Sustained:
Days Payable increased from 29 in FY21 to a high of 90 in FY24, temporarily cushioning the CCC rise. However, a drop to 59 days in FY25 further stretched the cash cycle, increasing working capital needs.FY25 Working Capital Strain Likely to Pressure Cash Flows:
The record-high CCC of 233 days suggests capital is locked in receivables and inventory for over 7 months—posing a liquidity challenge and possibly explaining the weak free cash flow (–₹16 Cr) despite decent CFO recovery.


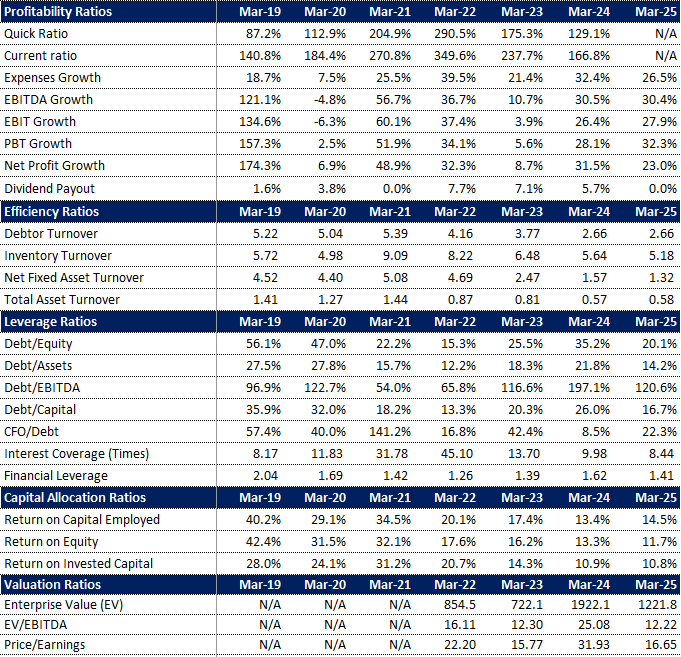
7. KEY RATIOS:
8. Shareholding Pattern:
Very high public holding while promoters are on a selling spree! Should stay very cautious about it.

9. Concall Analysis—Q4FY25:
9.1 Q4 FY25 (Year-on-Year):
Total Operating Income: INR 128 crores (23.15% increase)
EBITDA: INR 28.5 crores (74.84% increase), with an EBITDA margin of 22.31%
Net Profit: INR 16.2 crores (7.28% increase), resulting in a PAT margin of 12.63%
9.2 Segment-wise Performance and Future Outlook:
A. Microcrystalline Cellulose (MCC) Business:
FY25 Revenue: INR 409 crores (35.75% growth from INR 302 crores in FY24).
Volume Growth (FY25): 29.57%.
Capacity & Utilization: Newly commissioned 7,000 metric ton per annum plant capacity is at 68% utilization. Current utilization: 19,100 tons against a capacity of 21,700 tons. Expected to reach near full capacity by FY26.
Growth Strategy: Aims for over 25% growth in the next 2-3 years. Capacity expansion to 25,000 metric tons through debottlenecking. Focus on higher-margin special grade products and co-processed excipients.
Pricing (Current): INR 214.3 per kg.
Market Share: Gaining market share through new product development with existing customers and acquiring business from competitors.
B. Operations & Maintenance (O&M) Service Business:
FY25 Contribution: INR 41 crores (17.66% year-on-year growth).
Q4 FY25 Growth: 17.9% to INR 10.76 crores.
Key Client: Adani Solar.
Future Outlook: Expected significant growth, targeting around INR 75 crores for FY26, with potential for higher achievement based on new contracts.
C. Active Pharmaceutical Ingredients (API) Business (Trimax):
FY25 Contribution: INR 29 crores.
Regulatory Status: Applied for 4 CEP certifications, secured one for Metformin HCL to enter European markets.
Margin Target: Targeting EBITDA margins of 25% or higher.
Market Focus: Initial sales mix of non-regulated and domestic markets, transitioning to regulated markets as approvals are obtained.
Key Molecules: Pregabalin, Metformin, Minoxidil, Retinovir, Meclizine, and Sitagliptin for regulated markets.
R&D: State-of-the-art R&D center in Hyderabad for API development, analytical research, and innovation.
Joint Venture: With Respilon, to co-develop next-generation drug delivery formats using their NUENEX nanofiber platform.
D. Croscarmellose Sodium (CCS) Facility:
Environmental Clearance: Received for the planned facility at Dahej-2 SEZ.
Commissioning: Expected by October 2026 (18-month timeline).
Capital Expenditure (Capex) & Funding: Approximately INR 90 crores capex required. INR 40-50 crores to be spent in the current fiscal year. Funded by IPO proceeds, with remaining through debt (INR 55-60 crores) or future equity issues.
Asset Turnover: Expected to gradually reach 3 to 4 times after initial one-time turnover. Optimal capacity utilization in 2 years.
Market & Application: CCS acts as a disintegrant, complementing MCC (binder). Existing MCC customers are potential CCS customers.
FDA Approval: Will be sought for the facility.
9.3 Other Key Insights:
A. Promoter Pledging:
Current pledge: 44% (increased from 23%).
Proceeds used for investing in preferential equity shares of the company.
Plans to reduce pledge percentage in the future, but no immediate action due to no urgent requirement.
B. Receivables:
Issues with foreign customer receivables largely resolved (90% received).
Remaining 10% expected, with delays due to country-specific foreign currency allocation.
C. Customer Base:
Top 5 customers contribute ~43% of revenue.
Top 10 customers contribute ~60% of revenue.
Approximately 350 customers this year, with over 500 total customers.
10. SWOT ANALYSIS:

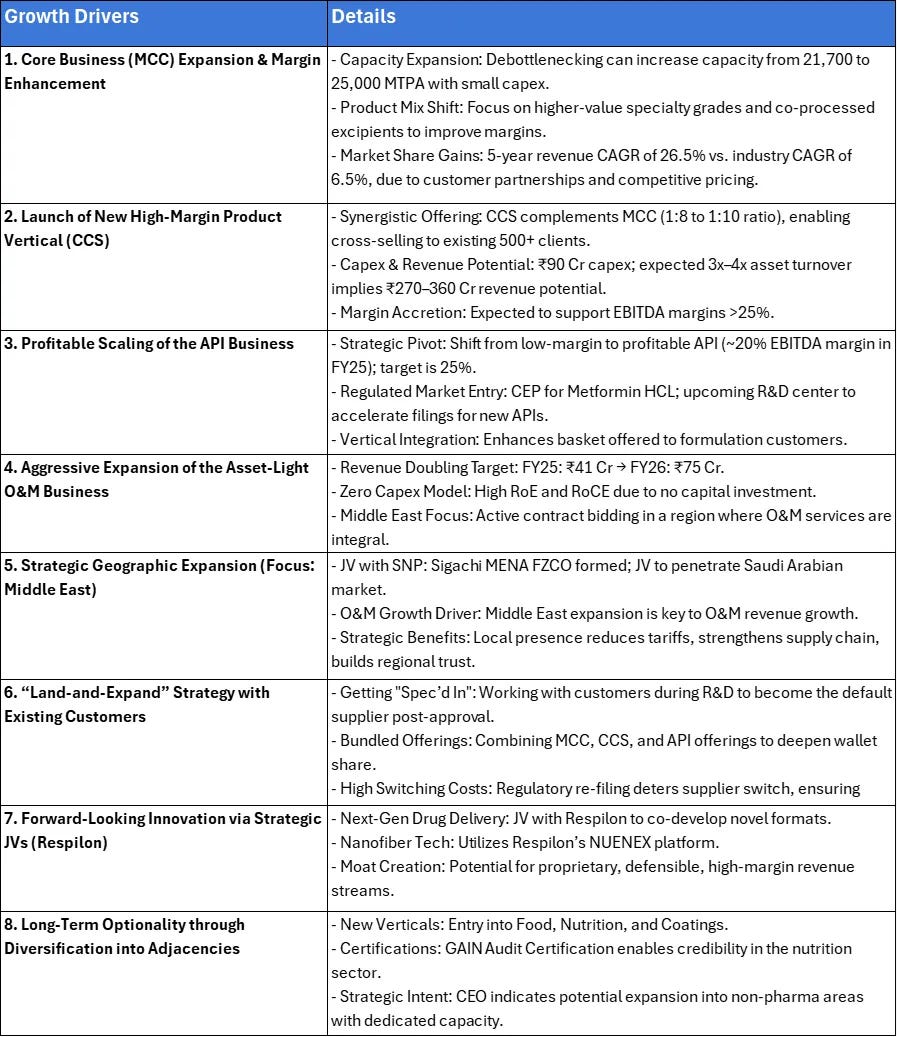
11. Growth Drivers
12. Competiors in the Market

1. Divi's Laboratories Ltd
A leading manufacturer of Active Pharmaceutical Ingredients (APIs) and intermediates. It also produces nutraceutical ingredients and has strong custom synthesis capabilities with a global presence.
2. Sun Pharmaceutical Industries Ltd
India's largest pharmaceutical company and a major global player in specialty generics. It manufactures and markets pharmaceutical formulations and APIs across more than 100 countries.
3. Vivimed Labs Ltd

A global supplier of specialty chemicals and pharmaceuticals, including APIs and active ingredients for personal care products. Operates in over 50 countries with multiple manufacturing units.
4. Deepak Nitrite Ltd
A diversified chemical manufacturing company producing pharmaceutical intermediates among other products. Serves sectors like agrochemicals, pharmaceuticals, dyes, and more.
5. SRF Limited
A multi-business chemical conglomerate engaged in the production of specialty chemicals, fluorochemicals, and packaging films. It has a global customer base across 90+ countries.
Thank You So Much For Reading!!
Researched By- Naresh, Mayank and Vaibhav
All information is sourced from the company's annual reports, Press Release, News Articles, GoIndiastocks.in, Screener.in, industry reports and Economy Outlook reports.
Disclaimer: We do not recommend buying or selling any stock. You should consult your financial advisor before buying or selling any financial instrument.
We are Proud to Announce Our New Launch of the Premium services where we Deep-dive into the Business and back you up with Robust Research.
We Provide services for different Level of Investors. You can Email us directly to start your journey!
If you like the hard work we put in, you can invest in us:
For our Non-Indian audience: You can donate to us through PayPal. Click here.
For our Indian audience, UPI QRs are given below:

Great write up! The numbers are getting strong as time goes n