


Hey Folks, here at EquityEdge Research, we make Small-Cap Investing easy for you by Backing you up with Robust & Full-Fledged Research.
Yes, we do use AI in our articles, but only to create a structure. We fact check and write the drafts on our own. If you find anything that seems suspicious/ erroneous, please feel free to comment below the article.
Please fill the form below if you are interested to know and would like a Free Sample Report showcasing what we offer in our Premium Services!
Check out our Previous Report here:

Let’s Go!
Table of Contents:
Key Highlights.
Company Price Chart Analysis.
About the Company.
Management Analysis.
Financial Analysis
Ratio Analysis.
Shareholding Analysis.
SWOT Analysis.
Competitors.
Premium (Includes Free):
Global Automotive Parts Industry.
Indian Automotive Parts Industry.
Financial Analysis- Quarterly.
Segment Wise Data.
Competitive Analysis- Bio & Financials.
Daily Share price trend TTM- Peer comparison.
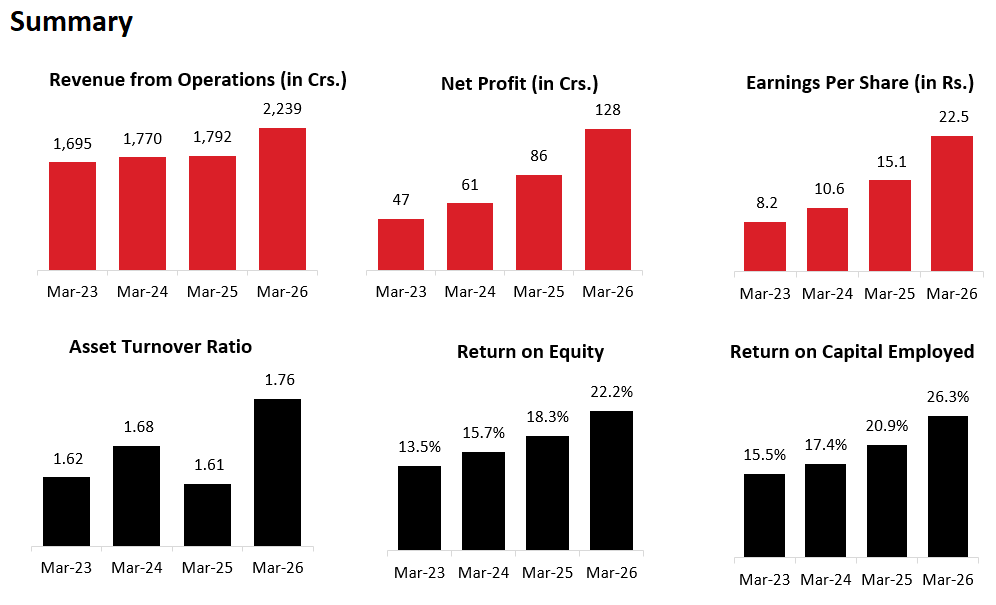
1. Key Highlights:
FY26
REVENUE: ₹ 2,178 Cr. (+4.81% YoY)
EBITDA: ₹ 237 Cr. (+7.73% YoY)
EBITDA MARGIN: 11% (No Change)
PAT: ₹ 164 Cr. (+5.13% YoY)
Q4FY26
REVENUE: ₹ 664 Cr. (+18.15% QoQ, +18.57% YoY)
EBITDA: ₹ 77 Cr. (+20.31% QoQ, +22.22% YoY)
EBITDA MARGIN: 12% (+100 bps QoQ, +100 in YoY)
PAT: ₹ 54 Cr. (+38.46% QoQ, +17.39% YoY)
OTHER HIGHLIGHTS:
Material cost (Q4): INR 4,518 mn, ~68% of revenue.
Capex spend: “more than INR 70 crores” in FY26.
Despite that, AAL reported it “was able to generate net of investments, INR 30 crores of cash” in FY26 (as described by management).
CV market level and trajectory: Management reiterated the >7.5T CV market has been on a “tremendous ride” and has been “consistently 400-plus” since FY23. FY26 industry volume cited at ~480k vehicles, ~16% above FY25.
Cyclicality perceived to have narrowed: Management agreed peaks/valleys have compressed: after FY23’s rebound, subsequent years saw variation “within the 5% until last year,” with FY26 a notable +16%.
FY27 outlook framed as “400+” but not quantified: They stated OEMs expect FY27 to be “a good year” and reiterated expectation of “400 plus”, but avoided forecasting 420/450/480, noting FY26 itself surprised vs initial forecasts.
Seasonality: Q1/Q2 described as “a typical softer market historically.” April/May utilization reflected this softness (see capacity section).
2. Company Price Chart Analysis:
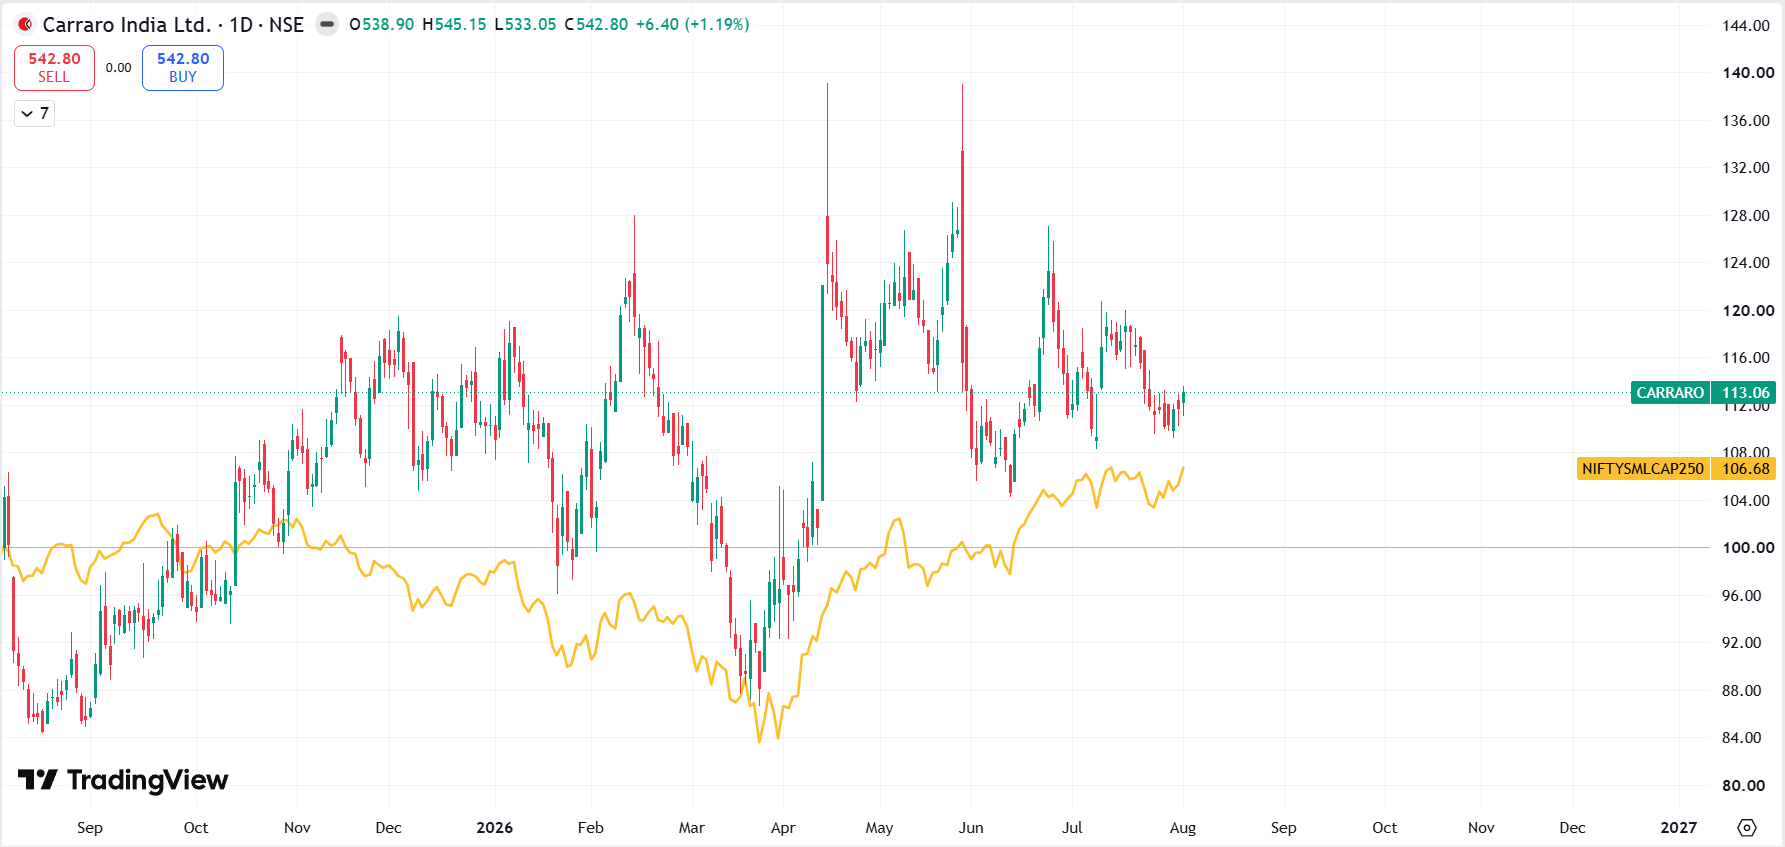
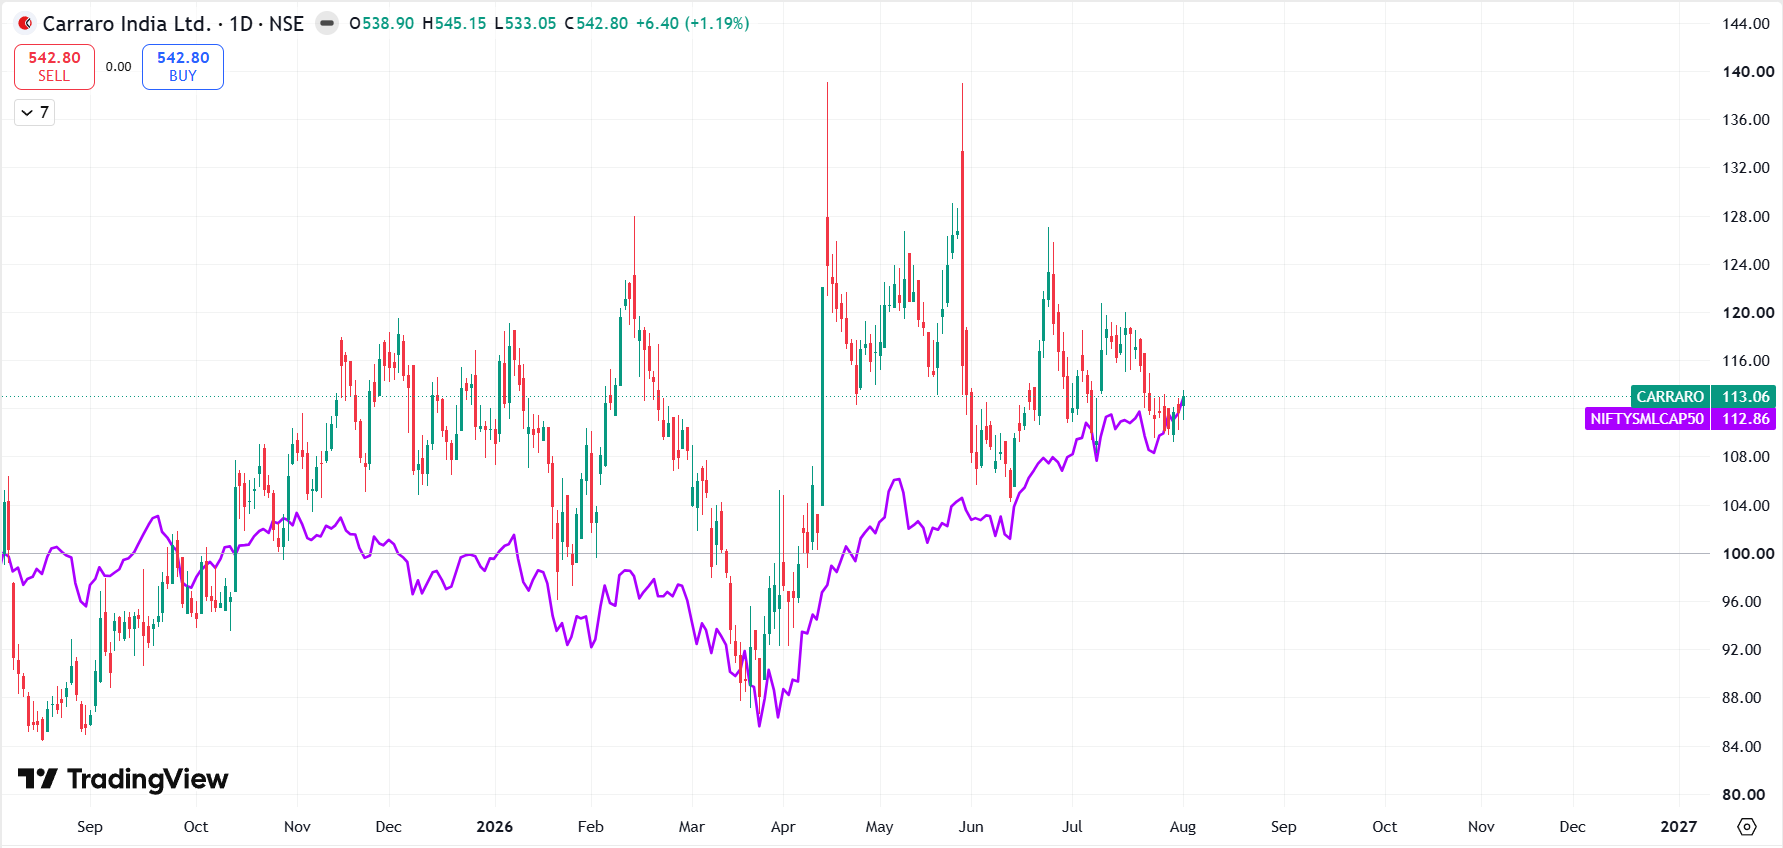
*Comparison charts are Indexed*
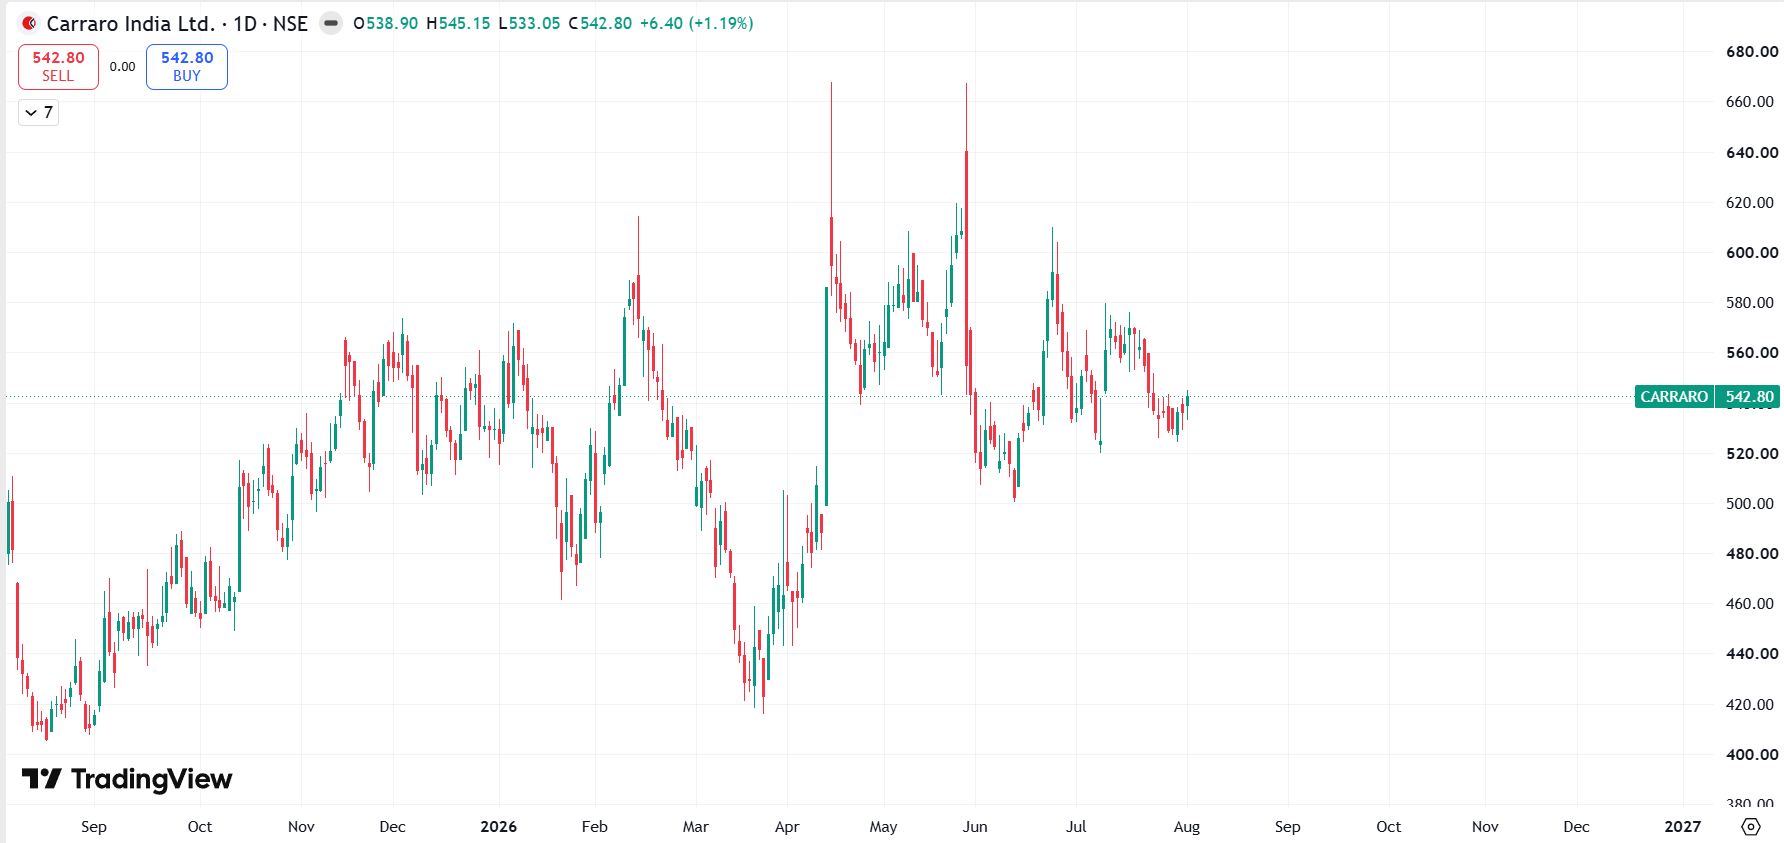
2.1 Carraro India Ltd. Performance:
2.2 Carraro India Ltd. Vs. NFTYSMLCAP250:
2.3 Carraro India Ltd. Vs. NFTYSMLCAP50:
3. About Company:
Carraro India Ltd. is an engineering and manufacturing company that supplies axles, transmission systems, gears and related components to OEMs in the agricultural tractor and construction equipment industries. It is part of the global Carraro Group and operates two manufacturing plants in Ranjangaon, Pune, along with an R&D centre.
The company primarily operates as a Tier-1 supplier, providing mission-critical drivetrain components that are integrated into customers’ tractors and construction vehicles. Its products are also supplied to industrial and automotive applications.
3.1 BUSINESS SEGMENTS:
1. Axles & Transmission Systems
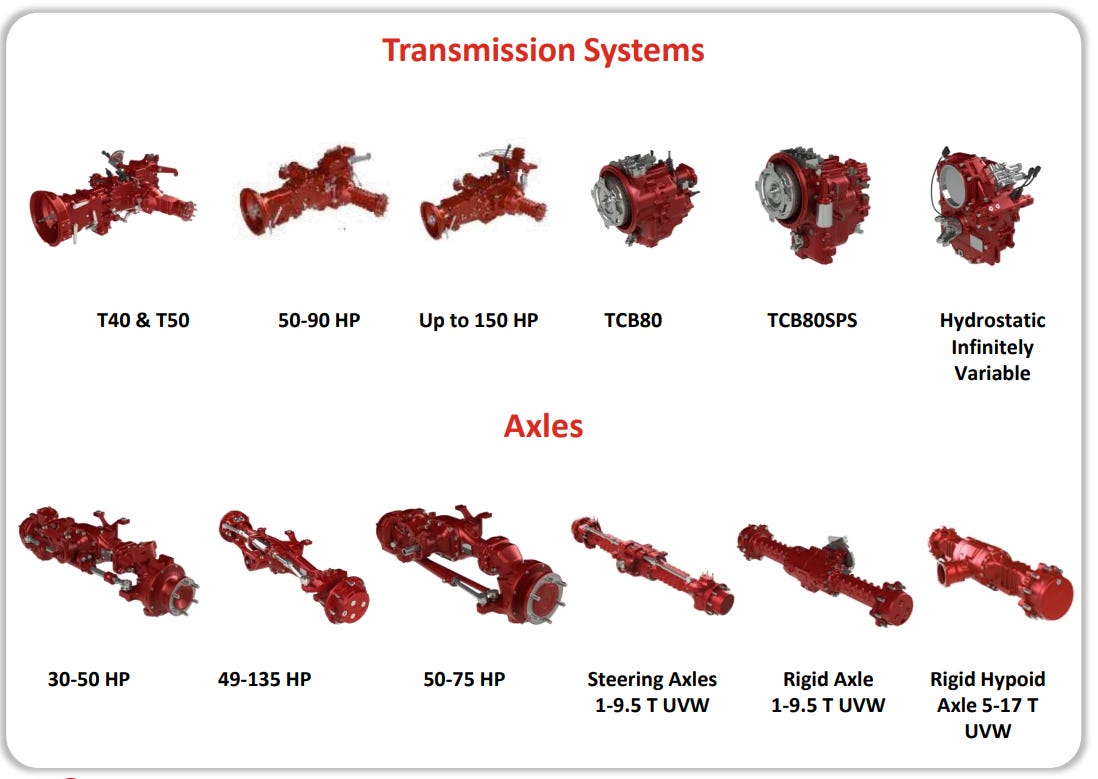
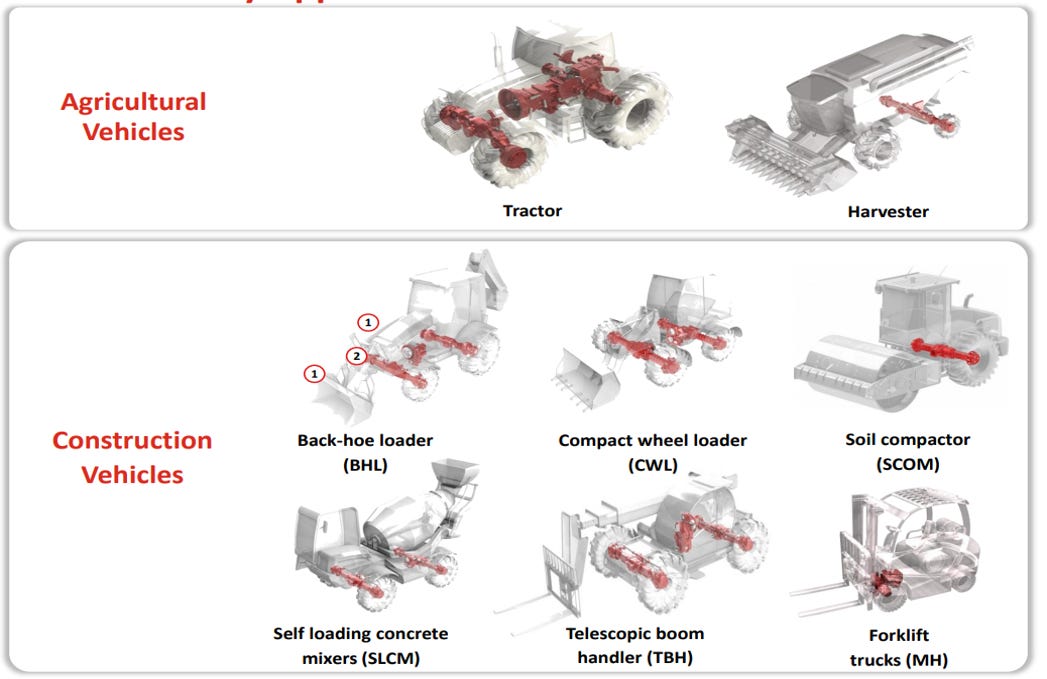
This is the core business vertical of Carraro India, comprising axles, transaxles and transmission systems for agricultural tractors and construction equipment. Its products are used in tractors, backhoe loaders, compact wheel loaders, soil compactors, concrete mixers and other off-highway vehicles.
2. Gears & Gear Shafts
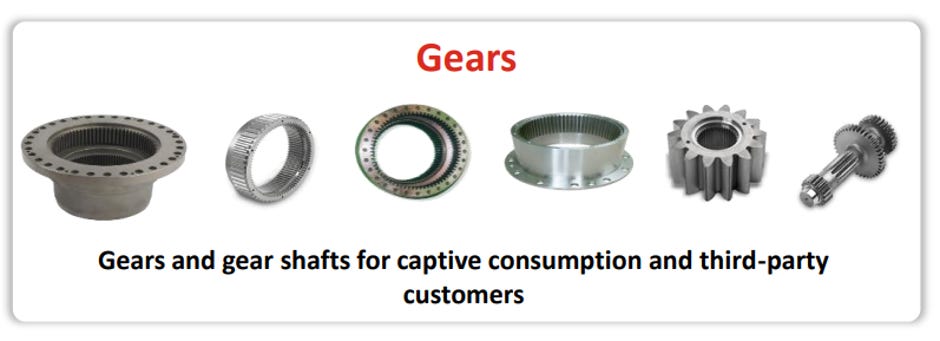
The company manufactures gears, ring gears and gear shafts for agricultural, construction, industrial and automotive applications. These products are used both for captive consumption in Carraro’s driveline products and for third-party customers.
3. Spare Parts & Other Components
Carraro India also supplies spare parts and other non-core components, primarily for agricultural tractors and construction equipment. This business complements its main driveline product portfolio and supports customers through the product lifecycle.
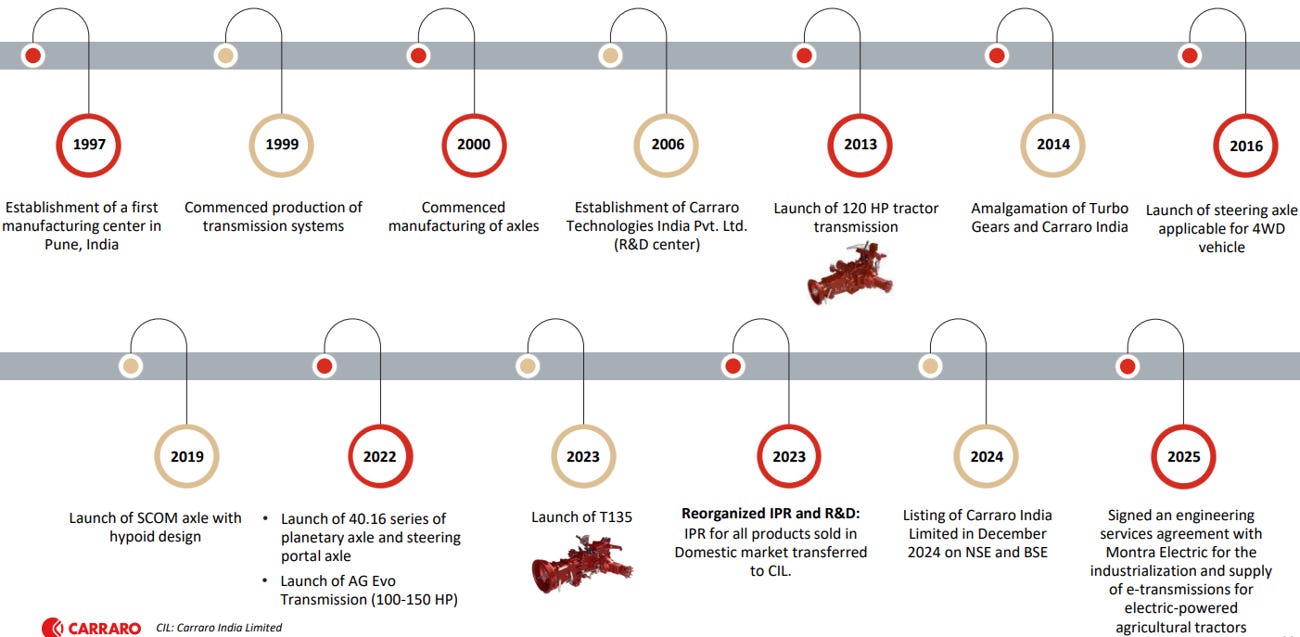
3.2 Company Journey
3.3 Product Offering
3.4 End Industry Application
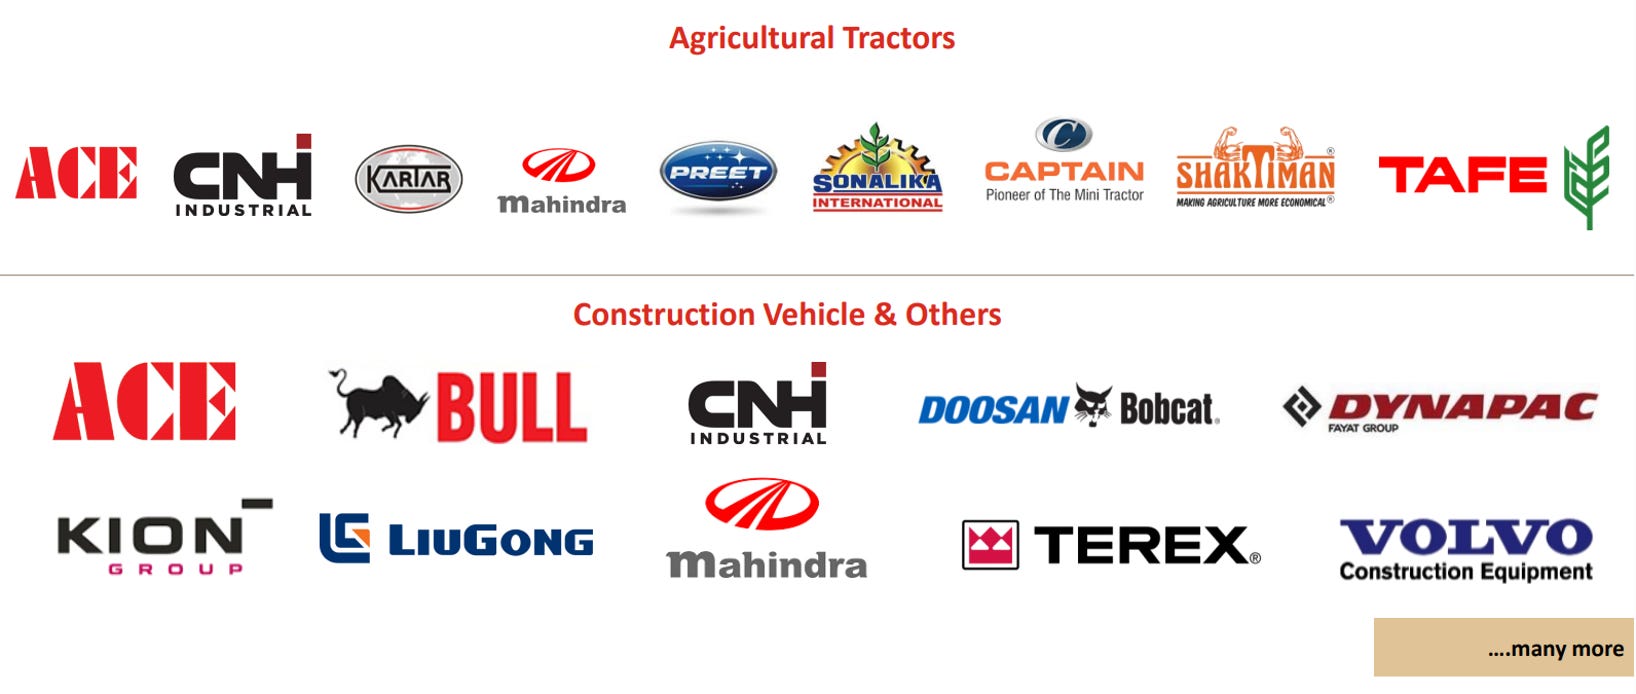
3.5 Marquee Customers
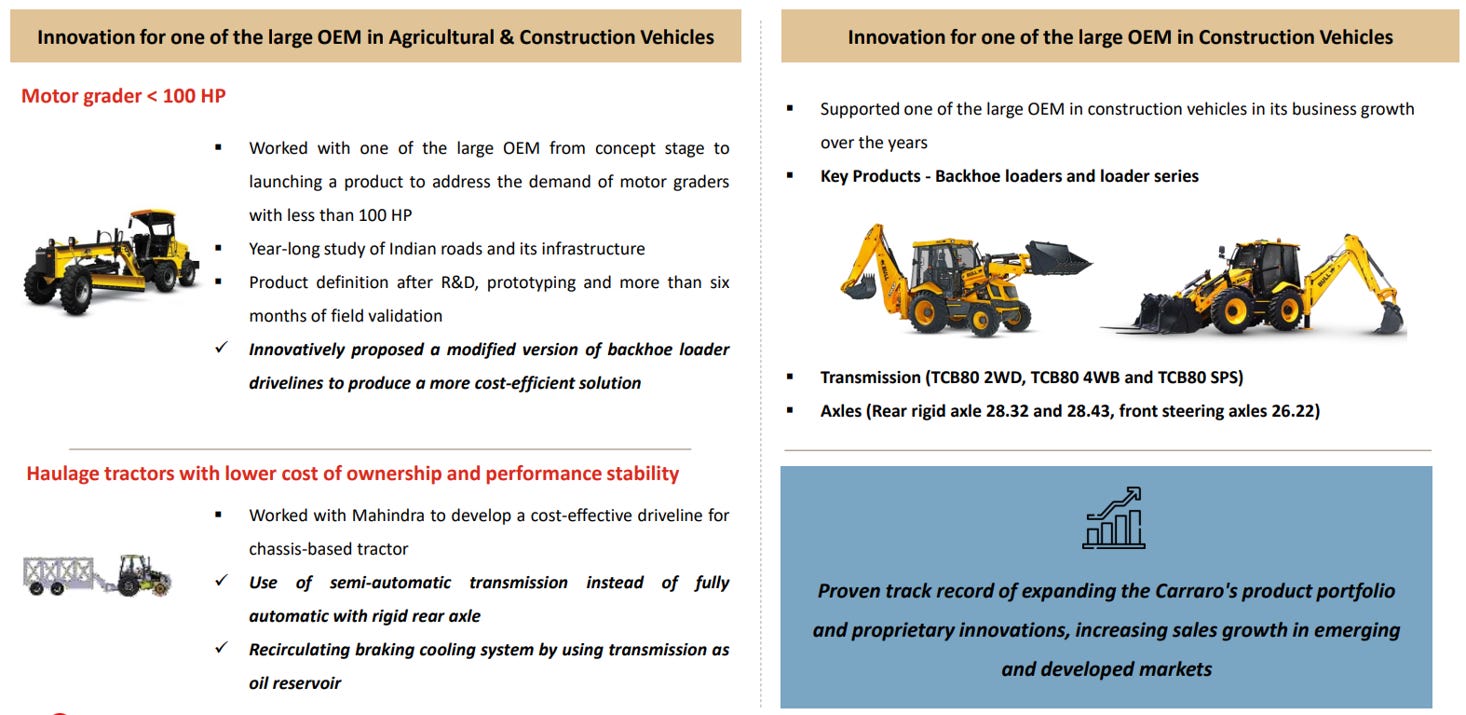
3.6 Customer Centric & Customized Solutions
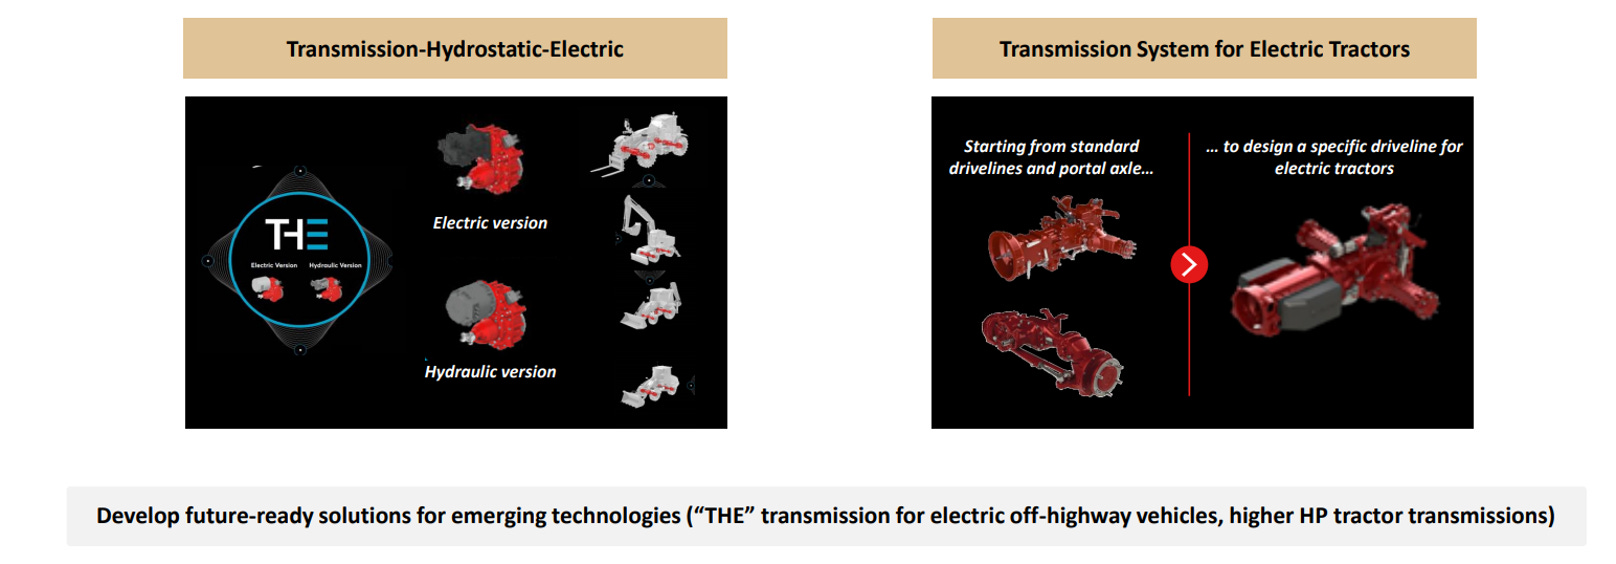
3.7 Future ready products for Emerging Technologies
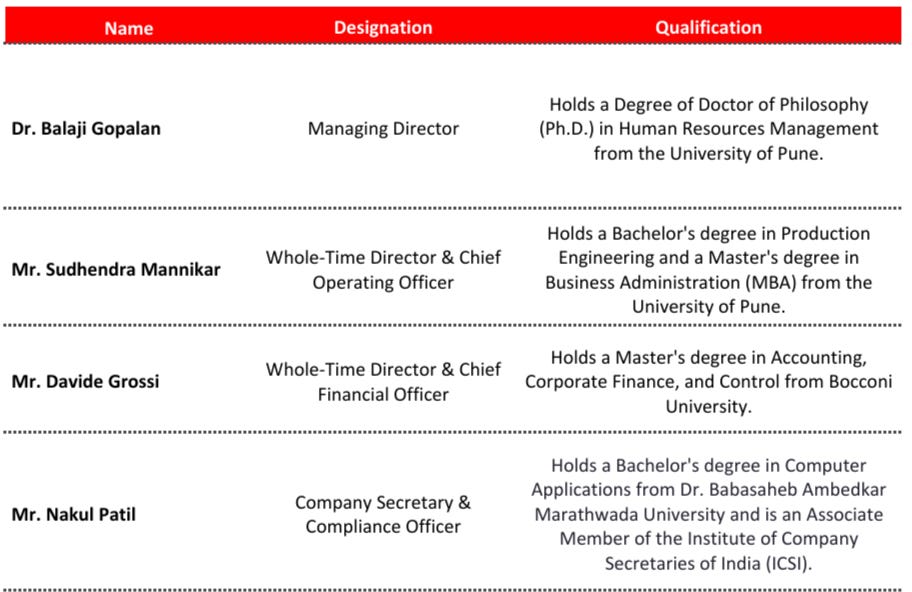
4. Management Overview:
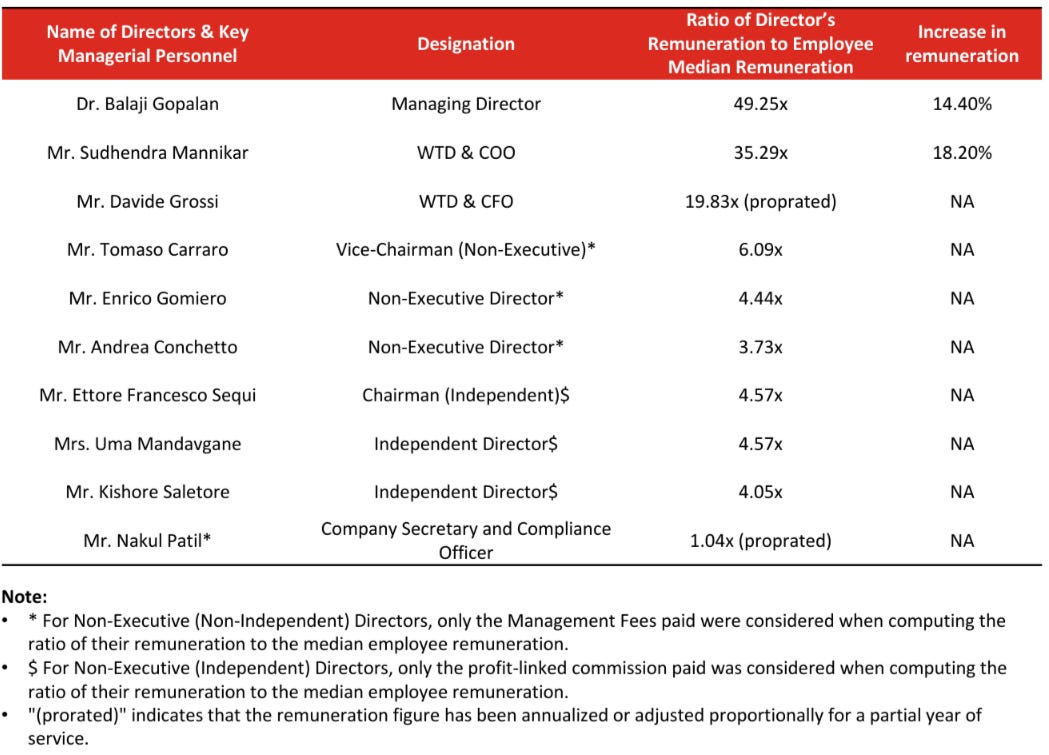
4.1 KMP’s Remuneration:
Before we move on to the Financials, we would appreciate if you could subscribe. This way we can reach out to you personally during our special offers or announcements in the future.
5.1 QUARTERLY ANALYSIS:
(Read detailed Quarterly Analysis in the Premium Version)
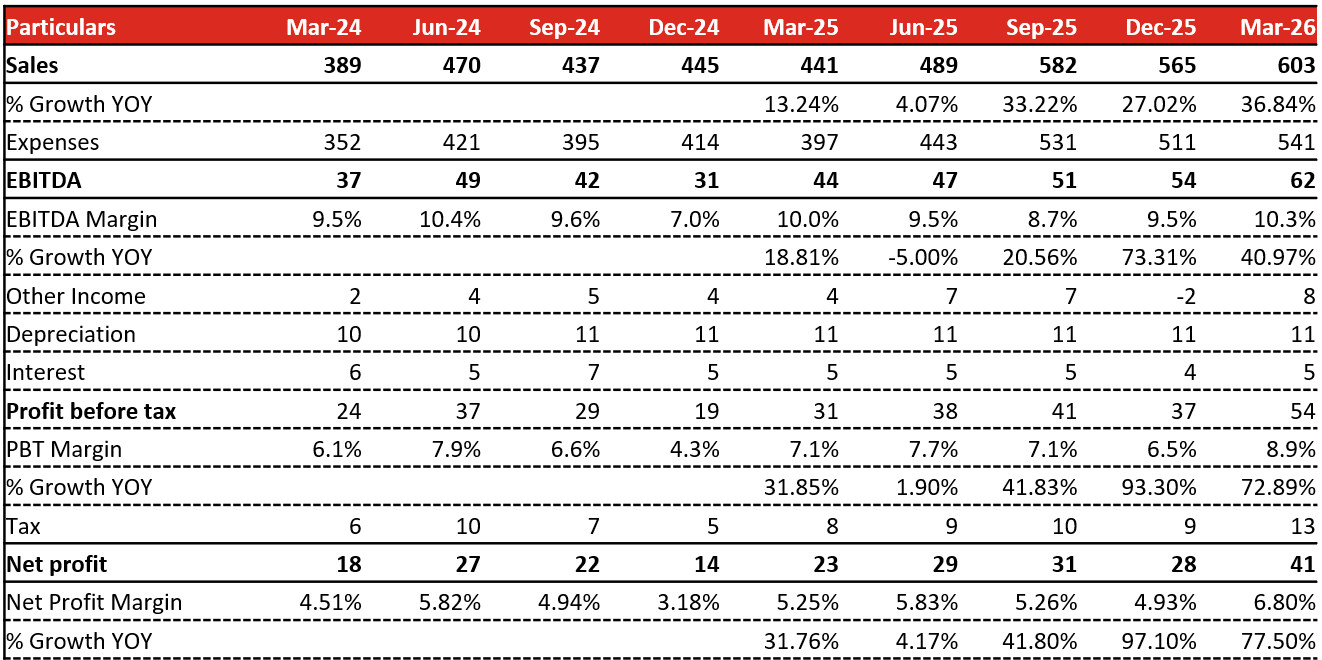
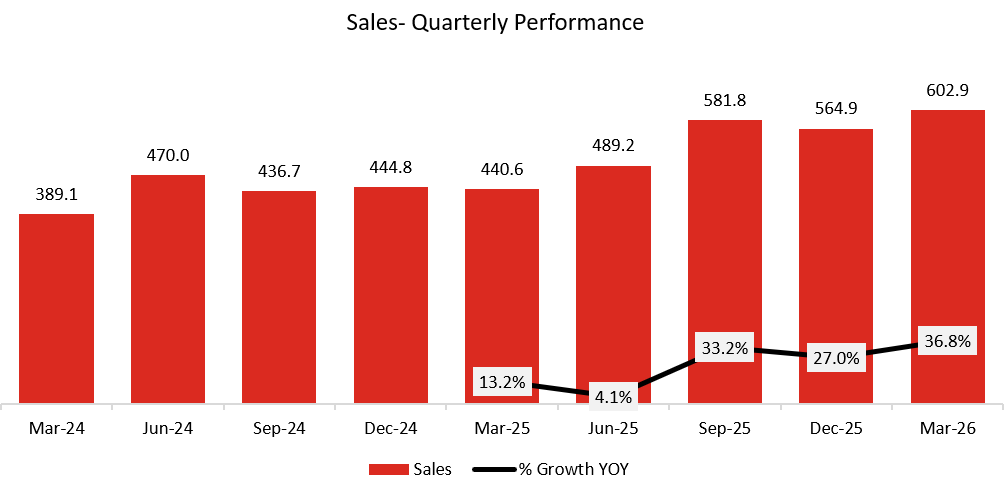
Growing at a CGR of 5.6% in last 9 Quarters.
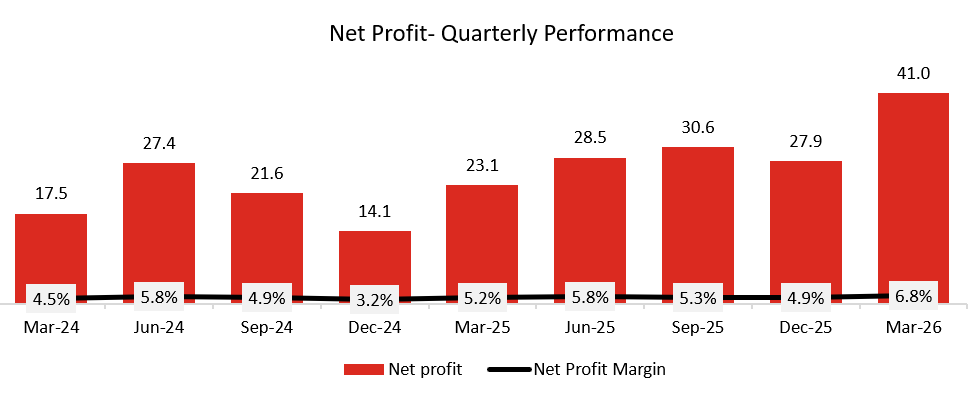
Growing at a CGR of 6.7% in last 9 Quarters.
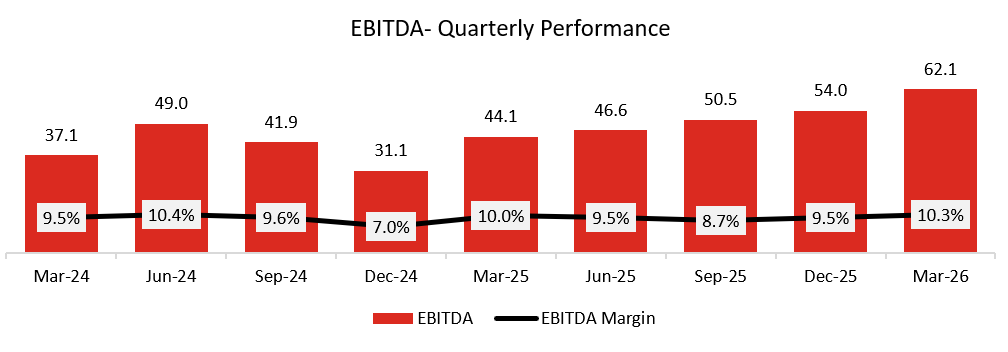
Growing at a CGR of 11.2% in last 9 Quarters.
5.2 ANNUAL ANALYSIS:
(Read detailed Annual Analysis and Forecasts in the Premium Version)
5.2.1 Revenue:
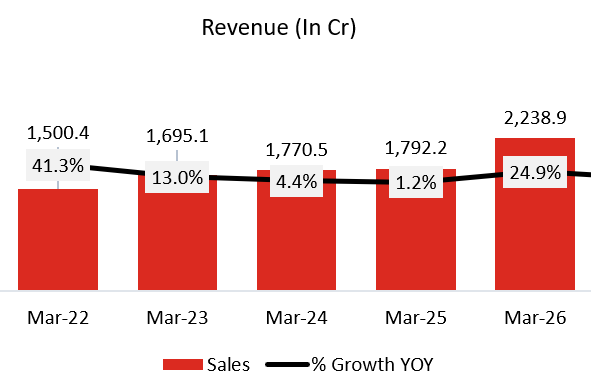
5Y CAGR: 10.5%
Revenue slowdown in FY24 and FY25
Exports contracted while domestic held. Europe and the US were cyclically weak, agriculture exports worst hit. Export revenue was ₹592 cr in FY25 against ₹813 cr in FY26.
Domestic agriculture and backhoe loaders kept the year flat rather than negative. The gear business fell in H2 FY25 and stayed there, taking the others segment down around 10%.
The programmes that later drove FY26 were only being seeded in FY25. Teleboom handler’s first export shipment came in Q4 FY25, and the new backhoe loader series order began dispatching only in April 2025. The weakness was demand-led. No customer or contract was lost.
FY24 has no call material. As inference: the same export cycle was already weakening, while four-wheel drive penetration at 14% to 15% was too small to offset it. It reached 20% only in FY25.
5.2.2 Gross Profit:
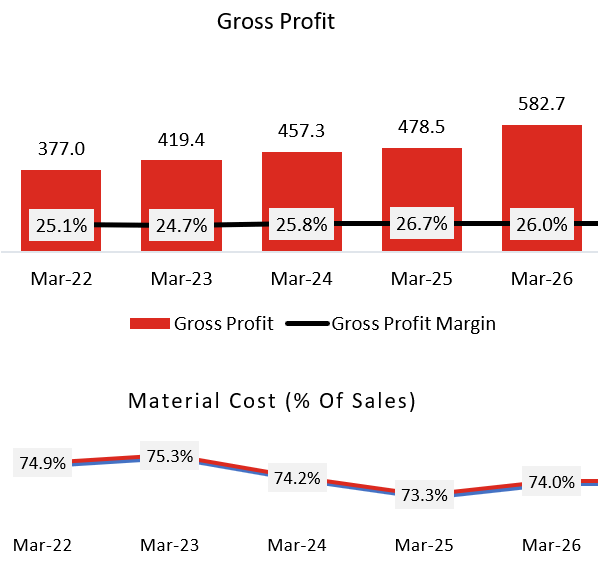
5Y CAGR: 11.5%
Gross margin moved only 90 basis points over the same period, from 25.1% to 26.0%. Most of the 480 basis point expansion sits below gross margin. Product mix drove what little gross margin gain there was.
5.2.3 EBITDA:
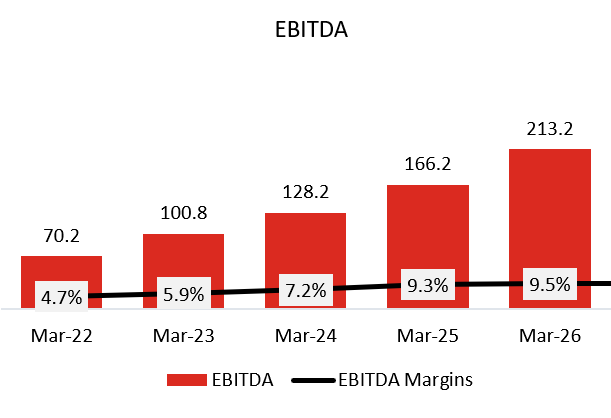
5Y CAGR: 32%
EBITDA margin expansion, 4.7% to 9.5%
Four-wheel drive axles carry higher realisation, and penetration above 40 HP went from 1% to 2% in FY21 to around 24% in FY26.
Localisation moved from 67% to 78%, saving 12% to 15% per localised part on duty and freight.
FY26 gross margin actually fell 70 basis points, because the fastest growing products carry the lowest localisation. Localisation follows volume, it does not precede it.
The bulk of the expansion is fixed cost absorption and labour productivity. Costs were held near a fixed base while revenue grew, and a four-year wage agreement embeds a 20% labour efficiency gain without headcount addition. Power and fuel, other manufacturing expense and selling and admin all compress as a share of sales.
5.2.4 Net Profit:
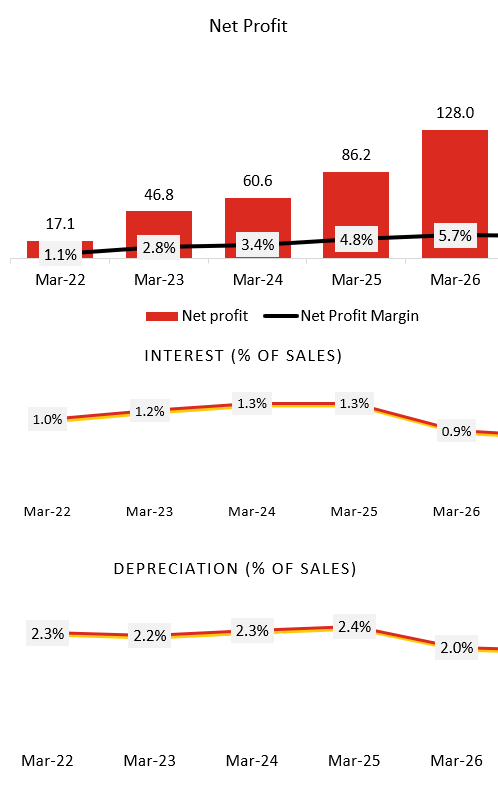
5Y CAGR: 65.5%
PAT growth and margin (7.8% to 24.3%)
PAT margin expansion mirrors EBITDA margin expansion for the most part, but two smaller levers added on. Other income grew from ₹3 cr to ₹26 cr, rising from under 2% to 4% of sales, largely interest earned on LC-backed receivables that the company chooses not to encash early given its surplus cash position.
Depreciation and interest both shrank further as a share of sales, the company being effectively debt free with interest coverage at 452 times by FY26. Tax rate held steady around 25.5% throughout, so none of the margin gain came from tax. Net effect: PAT grew faster than EBITDA in percentage terms across the five years, from ₹14 cr to ₹158 cr.
5.2.5 Balance Sheet:
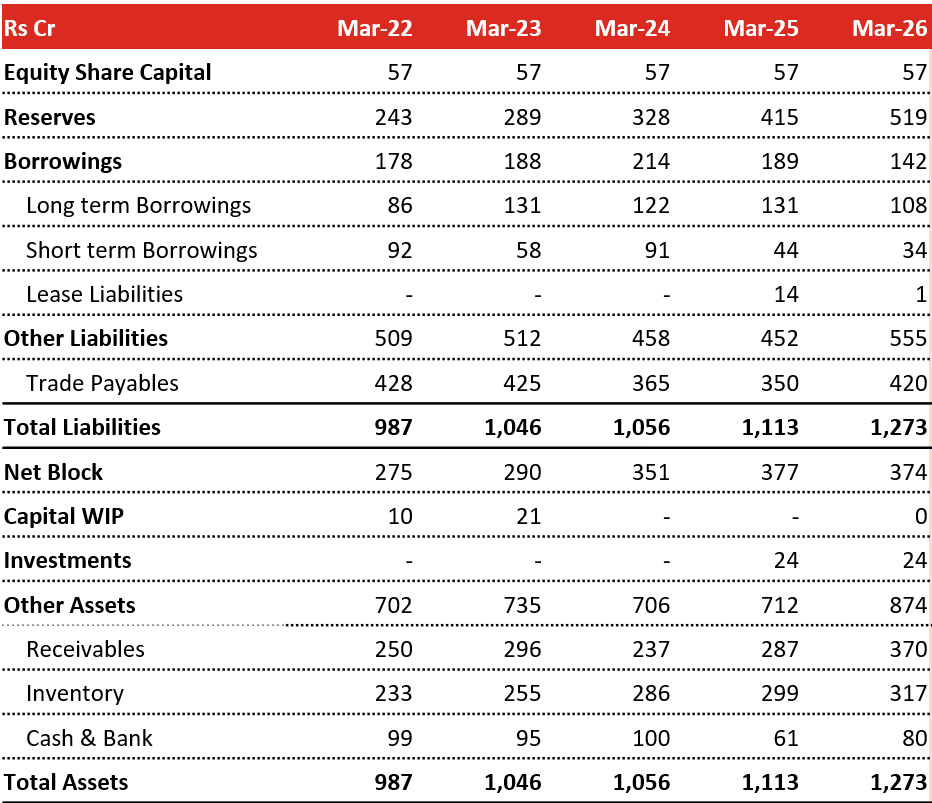
Debt as % of total assets falling
Reserves grew from ₹243 cr to ₹519 cr entirely through retained profit. Capex was modest through this period, ₹51.5 cr in FY25 and ₹41.7 cr in FY26, and was funded from internal accruals. Capital WIP is nil from FY24 onwards, meaning no large debt-funded project was underway.
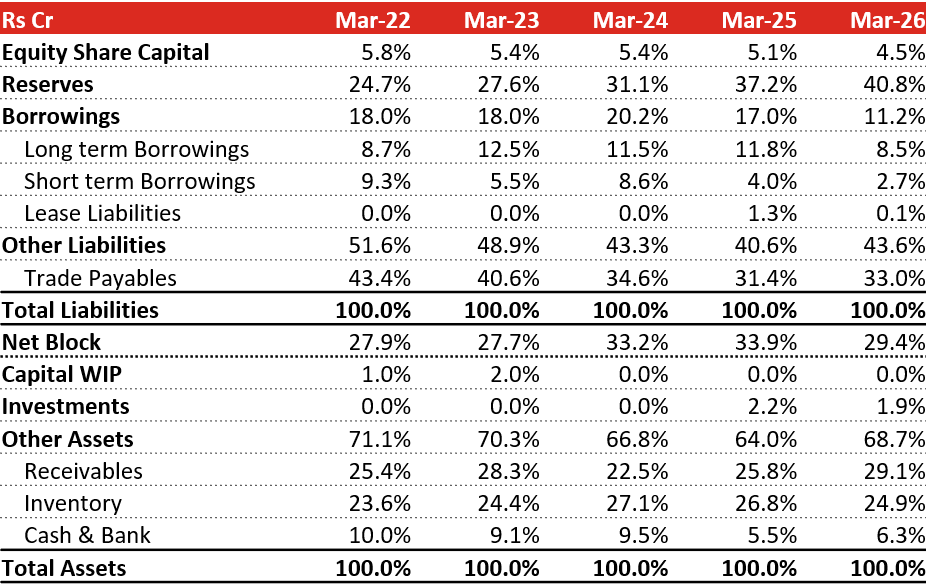
Equity grew faster than the balance sheet. Total assets rose 29% from FY22 to FY26; reserves rose 114%. Debt to equity moved from 0.42x to 0.27x in FY26 on the same basis.
The reduction is concentrated in short term borrowings, down from ₹92 cr to ₹34 cr. Long term borrowings stayed roughly flat at ₹86 cr to ₹108 cr. So the company used cash generation to clear working capital lines, not to prepay term debt.
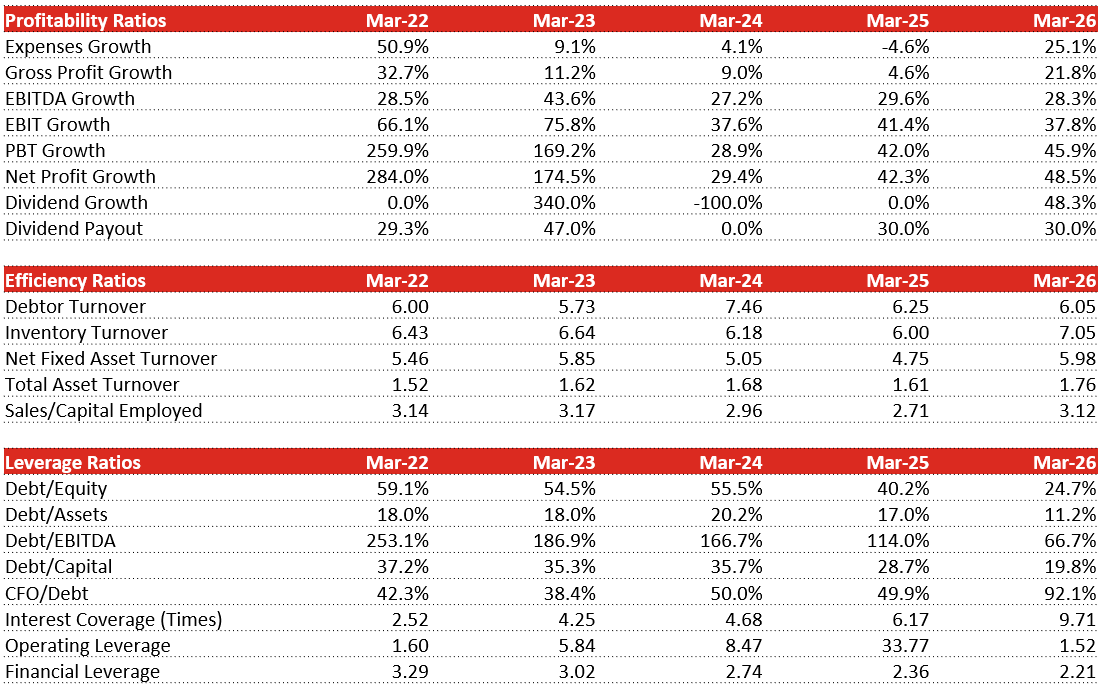
Interest cost fell to ₹19 cr in FY26, the first absolute decline in the series, and interest coverage moved from 3x to 10x.
Note for FY27: capex is guided at ₹130 cr to ₹140 cr, funded through a mix of accruals and debt. Net debt reduction is not expected to continue into FY27.
Receivables and inventory high as % of assets
Together they run at 48% to 55% of assets through the period. This is structural to the business, not a warning sign.
Net block is only 29.4% of assets. The manufacturing model is machining and assembly of largely bought-in components, with the IP sitting in design rather than in heavy plant. That combination produces low fixed assets and high working capital by default.
Trade payables at ₹420 cr in FY26 exceed receivables at ₹370 cr, and payables have been the largest single liability in every year, 31% to 43% of the balance sheet. Suppliers are financing a large part of the working capital cycle, not the company’s own capital.
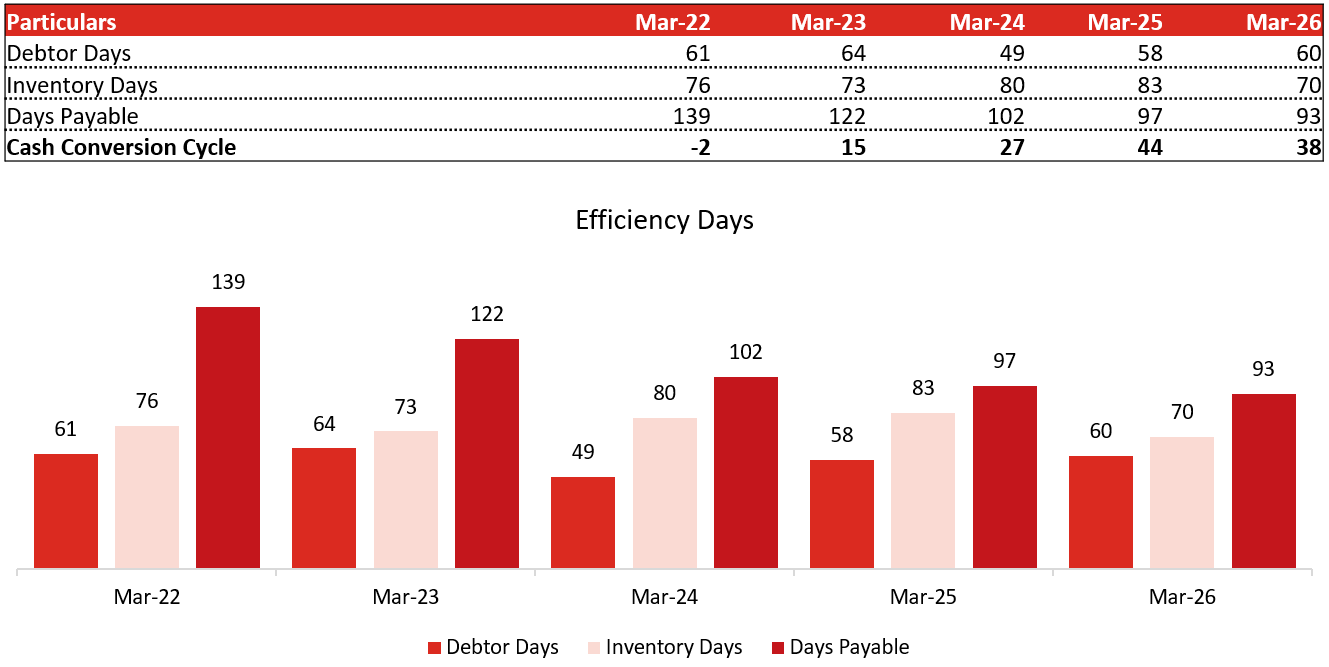
Working capital days actually improved, from 45 in FY25 to 38 in FY26, so the cycle tightened even as absolute numbers grew.
Receivables rose from ₹287 cr to ₹370 cr in FY26 in line with the revenue increase and the export share moving from 32.8% to 36%. Exports carry longer collection periods than domestic, which lifts receivables at the same credit terms.
Inventory grew only from ₹299 cr to ₹317 cr against 24.9% revenue growth, and fell as a share of assets, from 26.8% to 24.9%. Two reasons for holding stock: products are engineered and validated, so ramping production takes a month to six weeks and needs buffer stock; and the plant ran above 90% utilisation through FY26, leaving no slack to absorb demand spikes without inventory on hand.
5.2.6 Common-Size Balance Sheet:
5.2.7 Cash Flow Analysis:
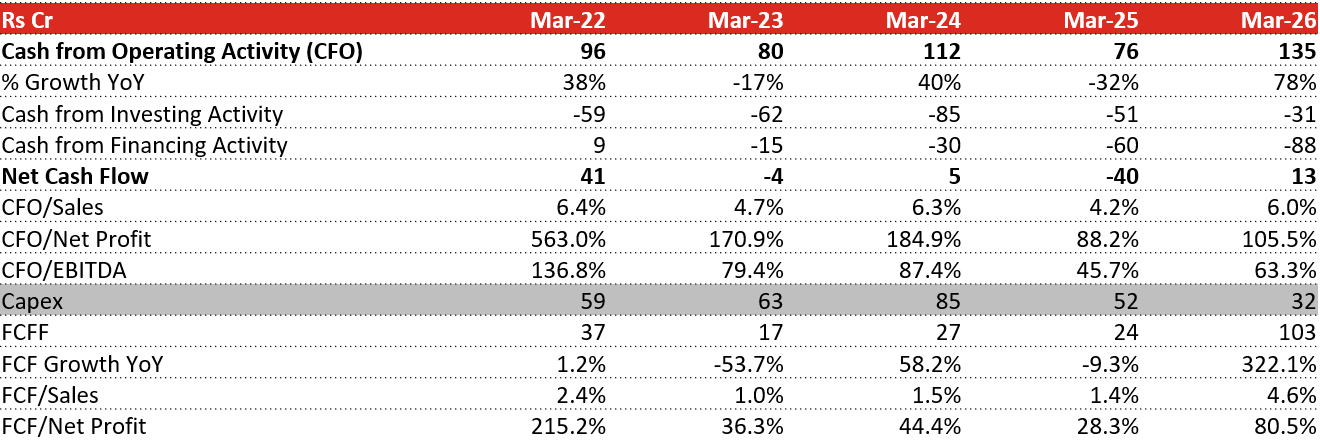
Note on Investment Purchase and Sale Activity
The cash flow statement shows large gross purchase and sale of mutual fund investments each year, for instance ₹63.67 cr purchased against ₹63.79 lakh sold in FY26, and similar near-matched pairs in FY23 to FY25. These numbers should not be read as investment income, portfolio building, or capital allocation activity. Investments on the balance sheet have stayed flat at ₹24 cr in both FY25 and FY26, confirming no portfolio is being accumulated.
We read this as a treasury cash sweep, where surplus operating cash is parked in liquid mutual funds between collection and payment dates and pulled back as required. No management commentary on this is available across the four concalls reviewed, so this reading is our inference from the cash flow pattern rather than a disclosed policy.
The gross purchase and sale figures inflate both investing inflows and outflows without a corresponding change in the company’s net cash position or asset base. Adding or netting these lines into any investing activity analysis without adjustment will overstate the scale of investing activity many times over.
5.2.8 Cash Conversion Cycle:
6. Key Ratios:
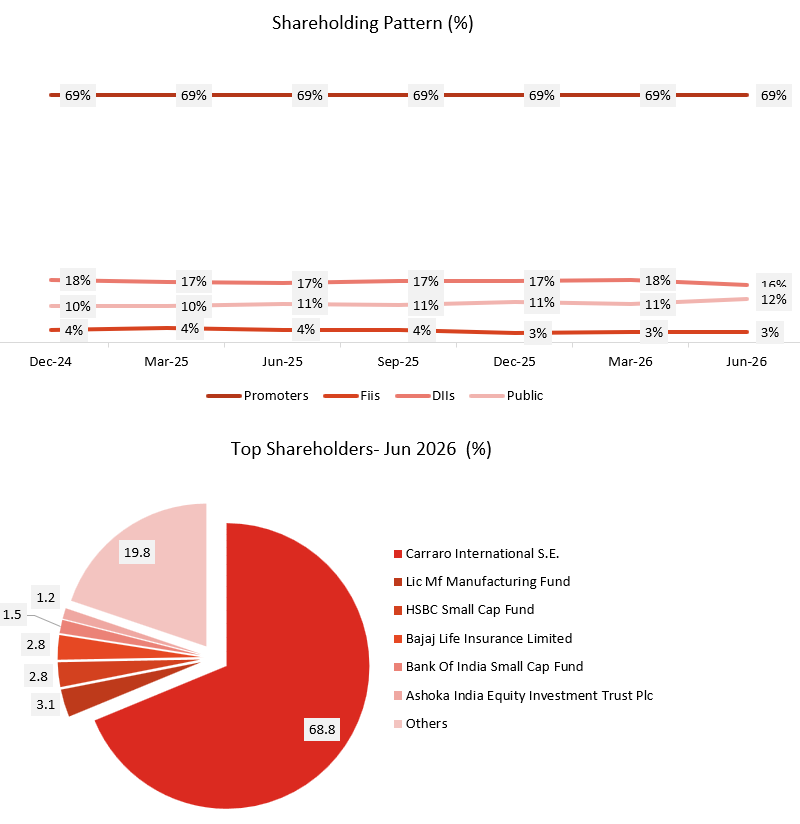
7. Shareholding Pattern:
You know, we have 3 Tiers to Our Offerings:
I am just starting out! – ₹999/month (Monthly Plan)
I know what I am doing! – ₹2,699/quarter (~₹899/month, Best Value)
I want to create wealth – ₹11,999/year (~₹999/month, Plus You get all access to all reports prepared till date)
You can start with any and can upgrade in between with no additional charges.
To know more, you can reach out to us at:
Email: team@equityedgereaearch.in
Ph No: +91 88590 79630
Please Continue….
8. Con-Call Analysis
1. Industry Environment & Structural Growth Drivers
Favourable Agricultural Sector Performance:
The domestic tractor market reached a historic milestone by crossing 1 million units in FY26. Favourable monsoon patterns, strong crop yields, and healthy rural liquidity significantly boosted purchasing power.
Management noted that current reservoir levels remain healthy, providing water availability to support ongoing agricultural activity even if rainfall patterns vary in the near term.
Farm mechanization continues as a secular, long-term trend, driving demand for larger-horsepower tractors that require highly sophisticated driveline systems.
Secular Shift Toward Four-Wheel Drive (4WD) Tractors:
Management identified the transition from 2WD to 4WD tractors as a major structural driver. The narrowing of the pricing differential accelerated by GST rate reductions has offset the previous cost disadvantages of 4WD tractors.
Operational Advantages: Farmers are increasingly prioritizing 4WD platforms due to superior traction in wet, muddy conditions, lower wheel slippage, reduced fuel consumption, and higher pulling capacities for advanced farm implements.
Growth Potential: While mature international markets have reached 95% to 98% 4WD penetration, India is in the early stages of this transition. Domestic 4WD penetration in the target segment (>40 HP) grew from 20%–22% in FY25 to 24% in FY26. Management targets a penetration level of 40%–45% over the next 3 to 5 years, allowing Carraro to outpace broader industry growth.
Domestic Construction Segment Softness: The domestic construction market remained subdued, with industry volumes declining by approximately 2% due to delayed project executions, slower infrastructure rollouts, and lower ordering activity.
2. Operational Performance & Segment Analysis
Domestic Agriculture Segment: Agricultural vehicle revenue stood at INR 1,019.2 crores, reflecting a 19% YoY growth. Growth was supported by demand for larger axle platforms, advanced driveline technologies, and expanding 4WD adoption.
Construction Segment Resilience: Construction vehicle revenue reached INR 983.7 crores, representing a 31% YoY growth. Backhoe Loader (BHL) Performance despite a domestic market decline of nearly 10% in the broader BHL segment, Carraro’s driveline sales to Indian construction customers grew by approximately 9% in FY26, indicating market share gains.
Tele Boom Handler (TBH) Platform: TBH remains a key growth platform, with progressive ramp-ups for major international and domestic OEMs on track. Management reaffirmed its long-term guidance, expecting TBH annual revenues to scale toward a INR 300 crore annual revenue opportunity by FY29.
3. Strategic Growth Platforms: High HP, Gear, and Engineering Services
Higher Horsepower Transmissions: Export demand for high-horsepower tractors continues to show signs of recovery. Carraro’s high-HP transmission program in Turkey is scheduled for Start of Production (SOP) in FY27, while its domestic Indian OEM program is expected to enter production in FY28.
Engineering Services Business: Grew to INR 10 crores (INR 100 million) in FY26, supported by demand for advanced product configurations, design validation, and engineering support. Montra Electric Project signed a major INR 17.5 crore engineering services agreement for the industrialization and supply of electric tractor transmissions. Prototype orders have been delivered, and field validation is currently underway.
Gear Business Recovery: Though gear revenues remained subdued in FY26, the company secured a major OEM nomination for bull gears valued at INR 15 crores annually, commencing in FY28. Two additional customer programs are currently under active discussion.
4. Financial Highlights & Capital Allocation
Balance Sheet and Working Capital Efficiencies:
Debt Reduction: Tighter cash generation and operational discipline helped reduce the debt-to-equity ratio to 0.27x in March 2026, down from 0.42x in March 2025.
Working Capital Optimization: Working capital days were reduced to 38 days in FY26, down from 45 days in FY25.
High Capital Returns: Return on Capital Employed (ROCE) reached 29.2%, while Return on Equity (ROE) improved to 25.5%.
FY26 & FY27 Capex Outlay:
FY26 Capex: Spent INR 41.7 crores on TBH axle production, transmission programs, and capacity upgrades.
FY27 Capex Guidance: Confirmed capital expenditure of INR 130–140 crores (expected to remain closer to the INR 130 crores level) to support new programs and capacity expansion.
Shareholder Returns: The Board recommended a final dividend of INR 6.75 per equity share, representing an approximate 30% payout ratio.
5. Operational Efficiencies: Localization and Margin Dynamics
Margin Expansion Strategy: EBITDA margins improved from 10.2% to 10.8% in FY26, driven by higher operating leverage, cost-control initiatives, and localized sourcing.
Q4 Gross Margin Squeeze Explained: Management clarified that the increase in raw material costs during Q4 was not driven by commodity price inflation, freight, or logistics costs. Instead, it was an adverse product mix in agriculture where customer demand unexpectedly shifted to specific axle configurations with higher material content. Management chose to prioritize customer supply continuity over short-term gross margins, while plant utilization helped support EBITDA via fixed-cost absorption.
Pass-Through Mechanism: Standard contract clauses protect long-term margins through a quarterly price adjustment mechanism with customers, operating with an average 3-month lag.
Localization Roadmap: Standalone localization reached 78% in FY26. Management targets scaling local sourcing to 86%–88% over the next 2 to 3 years to build supply chain resilience and enhance margins.
6. Key Q&A Insights and FY27/FY30 Outlook
Export Geography Mix: Standalone exports are routed via headquarters. The estimated geographic destination mix includes Europe (including Turkey) at ~50%, USA at 9% to 10%, China at 8% to 10%, and Latin America at ~10%.
4WD Outsourcing Penetration: Management estimates that 60% to 65% of India’s 4WD axle market is outsourced to specialized third-party players like Carraro, while 30% to 35% is manufactured in-house by tractor OEMs.
FY27 Growth Guidance: Under normal conditions, management expects revenue growth of 8% to 12%. Due to geopolitical volatility in West Asia, oil price fluctuations, and potential supply chain disruptions, growth may moderate to a range of 4% to 8%. Management explicitly stated they do not expect absolute revenue contraction versus FY26.
Margin Guidance: While avoiding absolute guidance, management confidently indicated margins will trend upward (”We will move upward. We will not slide backward”) driven by localization, efficiencies, and product mix.
FY30 Vision: Upgraded the long-term revenue target to a range of INR 3,500 to INR 4,000 crores by FY30, supported by WTE, TBH ramp-ups, engineering service projects, and global OEM partnerships.
9. SWOT ANALYSIS:
Strengths
Market Leadership in Off-Highway Drivelines: Holds dominant non-captive market share in agricultural tractor axles and construction transmissions, backed by 25+ years of Tier-1 expertise and a unique position in domestic tractor transmissions.
Large, Scalable Manufacturing Base: Operates two advanced plants in Pune with high production volumes and an exceptionally low rejection rate of 0.01%, ensuring efficient and quality manufacturing.
High OEM Switching Costs: Co-engineers customized driveline solutions with OEMs, creating long validation cycles and strong customer stickiness through multi-year supply agreements.
Localized and Diversified Supplier Network: Maintains 78% localization with a 247-supplier network and dual sourcing strategy, reducing supply chain risks and dependence on single vendors.
Weaknesses
Manufacturing Concentration Risk: Entire production is concentrated at a single Pune location, exposing operations to regional disruptions and infrastructure risks.
Lower Gear Plant Utilization: The standalone gear plant operates below optimal utilization, reflecting uneven demand across product segments.
Import and Pricing Exposure: Dependence on imported raw materials and delayed pass-through of input cost increases can temporarily pressure margins.
Long Product Development Cycles: New driveline platforms require years of engineering and validation before commercial production, delaying returns on investment.
Opportunities
Rapid Shift to 4WD Tractors: Rising adoption of 4WD tractors in India provides significant growth potential, aligning with the company’s planned capacity expansion.
Infrastructure and Construction Growth: Increasing infrastructure investments are expected to drive long-term demand for construction equipment transmissions and axles.
Early Positioning in Electric Drivelines: Development of electric tractor transmission solutions positions the company to benefit from the emerging farm electrification trend.
Export Market Expansion: Strong export growth offers opportunities to deepen presence across Europe, North America, China, Latin America, and other international markets.
Threats
OEM Backward Integration: Large tractor manufacturers may increasingly produce axles in-house, reducing the addressable market for independent suppliers.
Geopolitical and Export Risks: Trade disruptions, geopolitical tensions, and tariff changes could impact export demand and shipment schedules.
Freight and Commodity Inflation: Rising logistics and raw material costs may compress margins due to delayed price pass-through mechanisms.
Cyclical End-Market Demand: Weak infrastructure spending and poor monsoons can adversely affect construction equipment and agricultural machinery demand.
10. Competitors:
10.1 Automotive Axles Ltd.
Market Cap: ₹ 2,722 Cr.
Automotive Axles Ltd., headquartered in Mysuru, Karnataka, operates in the Automotive Components Industry. The company manufactures axles, axle assemblies, brakes, and other drivetrain components for commercial vehicles, buses, and off-highway applications.
Business Model:
Automotive Axles follows a B2B manufacturing model, supplying drivetrain and braking solutions primarily to vehicle manufacturers.
Its key products include drive axles, non-drive axles, front axles, brakes, and transmission-related components.
Revenue is generated through:
OEM supplies to commercial vehicle manufacturers.
Aftermarket sales and replacement parts.
Exports and supplies to global customers.
The company has strong exposure to medium & heavy commercial vehicles and off-highway vehicles.
What Sets Them Apart:
Specialized Product Portfolio: Strong expertise in axles and drivetrain systems.
OEM Relationships: Long-standing relationships with major commercial vehicle manufacturers.
Technology & Manufacturing Expertise: Focus on advanced axle and braking solutions.
Diversified End Markets: Exposure to commercial vehicles, buses, defence, and off-highway applications.
10.2 GNA Axles Ltd.

Market Cap: ₹ 2,308 Cr.
GNA Axles Ltd., headquartered in Hoshiarpur, Punjab, operates in the Automotive Components and Forging Industry. The company manufactures rear axle shafts, axle assemblies, spindles, and other forged and machined components, primarily for commercial vehicles and off-highway applications.
Business Model:
GNA Axles follows a B2B manufacturing model, supplying axle and drivetrain components to domestic and international OEMs.
Its key products include rear axle shafts, drive shafts, spindles, and other forged components.
Revenue is generated through:
Domestic OEM sales.
Export sales to global automotive customers.
Supplies to the aftermarket and off-highway segments.
The company has a significant presence in North America and Europe, alongside its domestic business.
What Sets Them Apart:
Axle Specialist: Strong expertise in axle shafts and drivetrain components.
Export-Oriented: Significant exposure to global commercial vehicle and off-highway markets.
Strong OEM Relationships: Supplies components to established automotive manufacturers.
Integrated Manufacturing: Forging, machining, heat treatment, and assembly capabilities.
10.3 Sona BLW Precision Forgings Ltd.

Market Cap: ₹ 48,920 Cr.
Sona BLW Precision Forgings Ltd., headquartered in Gurugram, Haryana, operates in the Automotive Components and Electric Mobility Industry. The company manufactures differential gears, differential assemblies, traction motors, starter motors, and other drivetrain components for passenger vehicles, commercial vehicles, and electric vehicles.
Business Model:
Sona Comstar follows a B2B automotive component manufacturing model, supplying critical drivetrain and electric powertrain components to global OEMs.
Its key products include differential gears, differential assemblies, traction motors, and starter motors.
Revenue is generated through:
Domestic and international OEM sales.
EV drivetrain and motor components.
Supplies to commercial and passenger vehicle manufacturers.
Aftermarket and replacement components.
The company has a strong global presence, with customers across North America, Europe, and Asia.
What Sets Them Apart:
EV-Focused Portfolio: Strong exposure to electric vehicle powertrain components.
Global OEM Relationships: Supplies critical components to leading automotive manufacturers.
Technology & Engineering: Strong capabilities in precision forging, differential technology, and electric motors.
Diversified Powertrain Exposure: Serves both conventional and electric vehicle platforms.