Hey Folks, here at EquityEdge Research, we make Small-Cap Investing easy for you by Backing you up with Robust & Full-Fledged Research.
Yes, we do use AI in our articles, but only to create a structure. We fact check and write the drafts on our own. If you find anything that seems suspicious/ erroneous, please feel free to comment below the article.
Please fill the form below if you are interested to know and would like a Free Sample Report showcasing what we offer in our Premium Services!
Check out our Previous Report here:

Here at EquityEdge Research, we make Small-Cap Investing easy for you by Backing you up with Robust & Full-Fledged Research.
Let’s Go!
Table of Contents:
Key Highlights.
Company Price Chart Analysis.
About the Company.
Management Analysis.
Financial Analysis
Ratio Analysis.
Shareholding Analysis.
SWOT Analysis.
Competitors.
Premium (Includes Free):
Global Hospitality and Tourism Industry.
Indian Hospitality and Tourism Industry.
Financial Analysis- Quarterly.
Competitive Analysis- Bio & Financials.
Daily Share price trend TTM- Peer comparison.
1. Key Highlights:
FY26
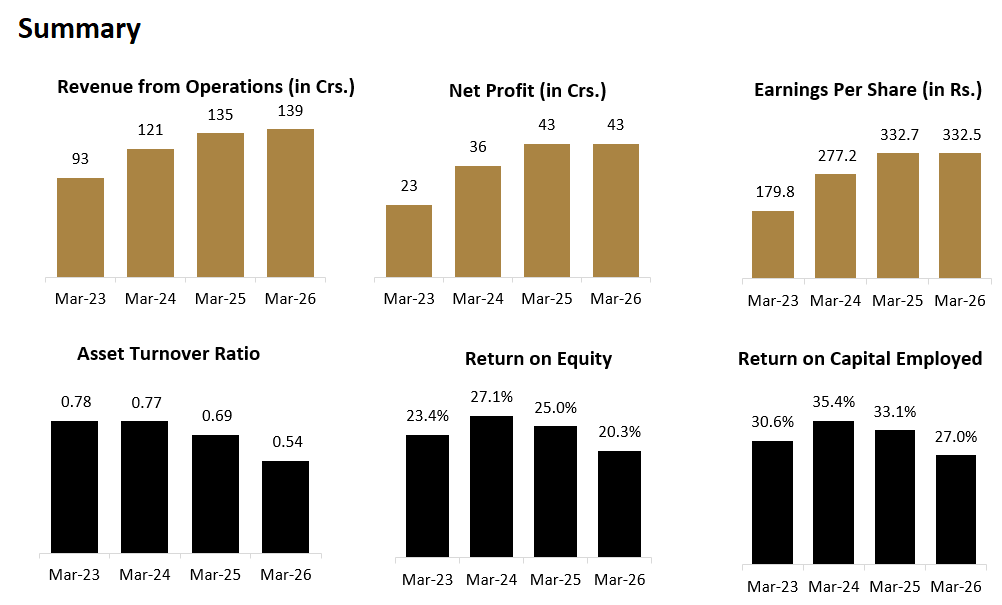
Revenue₹135 cr in FY25 to ₹139 cr in FY26 (+2.96% YoY).
EBITDA: ₹59 cr in FY25 to ₹60 cr in FY26 (+1.69% YoY).
EBITDA Margin (%): 43.70% in FY25 to 43.17% in FY26 (−53 bps YoY).
Net Profit: ₹43 cr in FY25 to ₹43 cr in FY26 (0.00% YoY).
Q1FY27
REVENUE: ₹ 33.89 Cr. (-30.27% QoQ, +35.51% YoY)
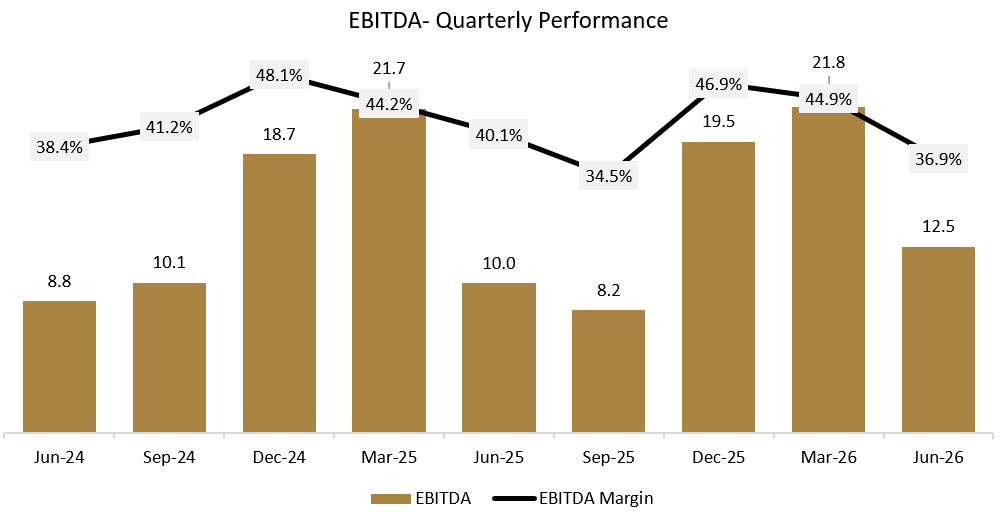
EBITDA: ₹ 12.49 Cr. (-42.79% QoQ, +24.53% YoY)
EBITDA MARGIN: 36.85% (-807 bps QoQ, -325 in YoY)
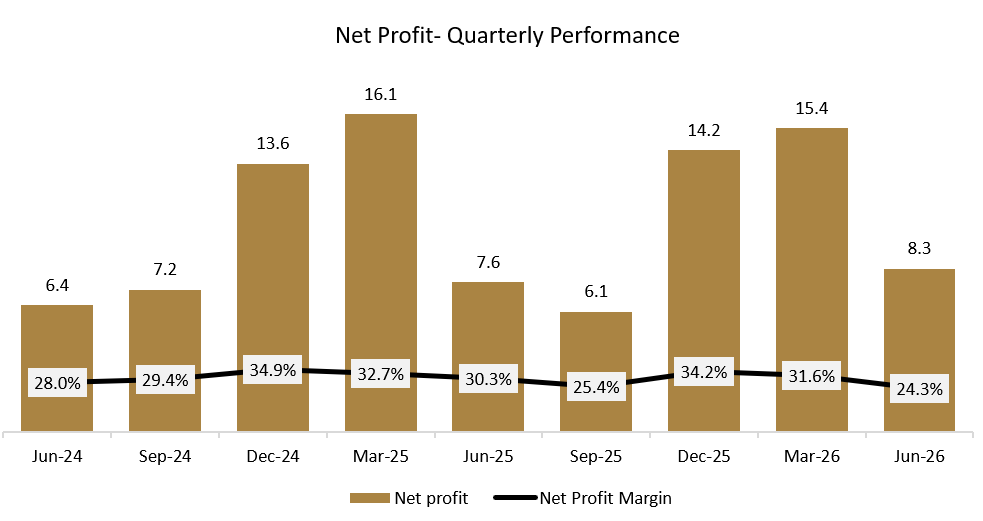
PAT: ₹ 8.25 Cr. (-46.25% QoQ, +8.84% YoY)
2. Company Price Chart Analysis:
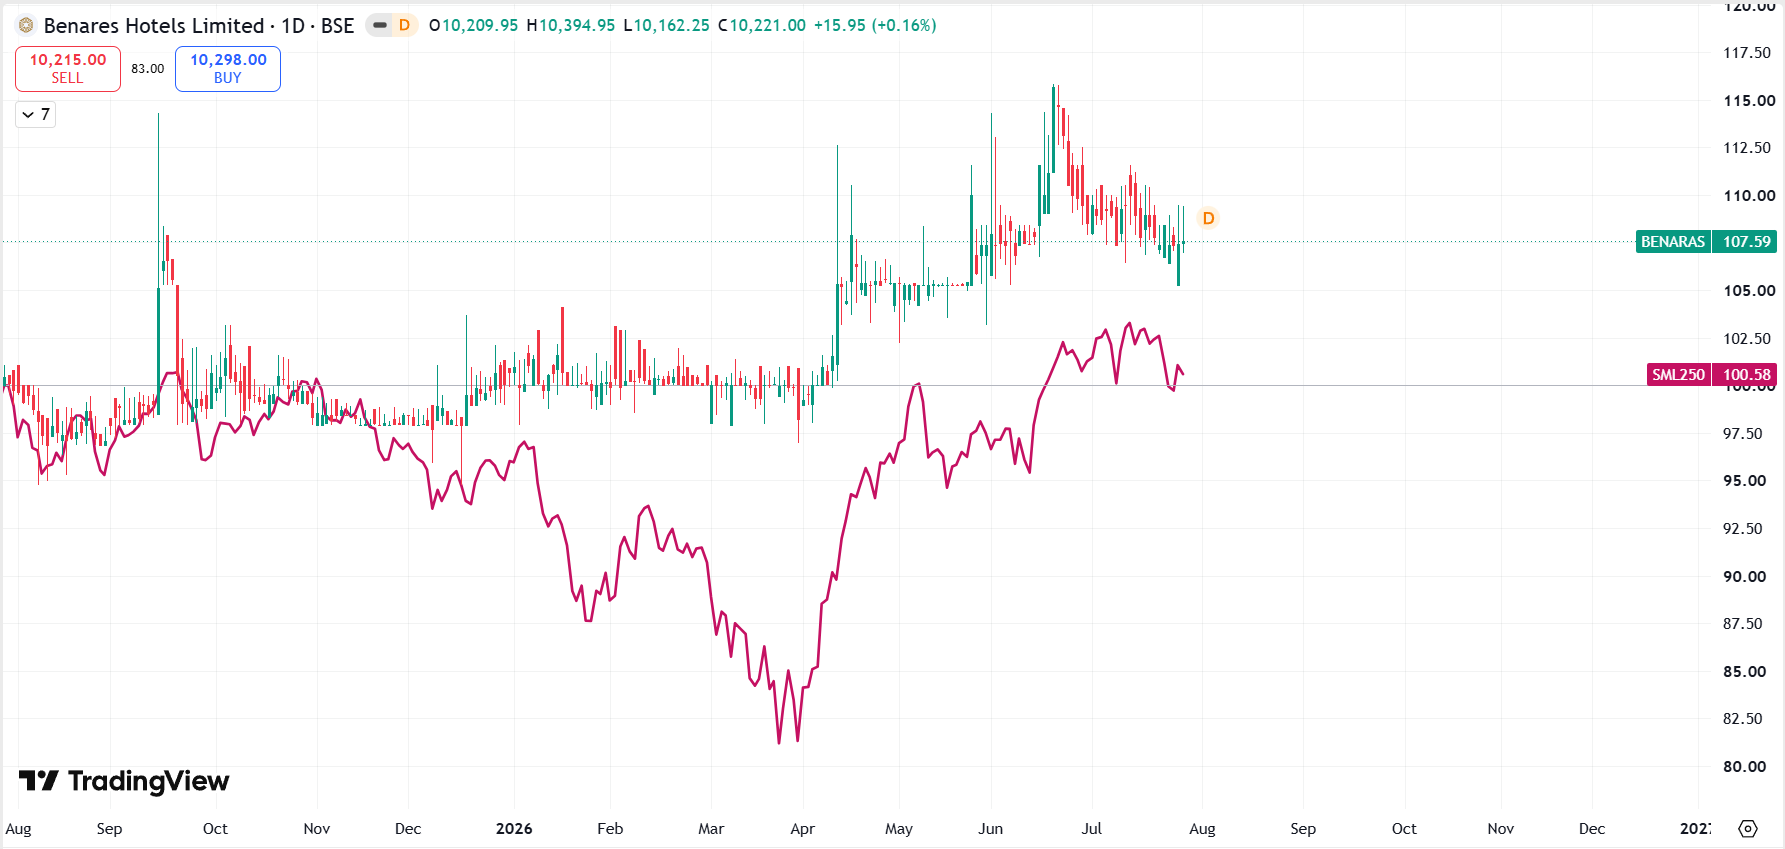
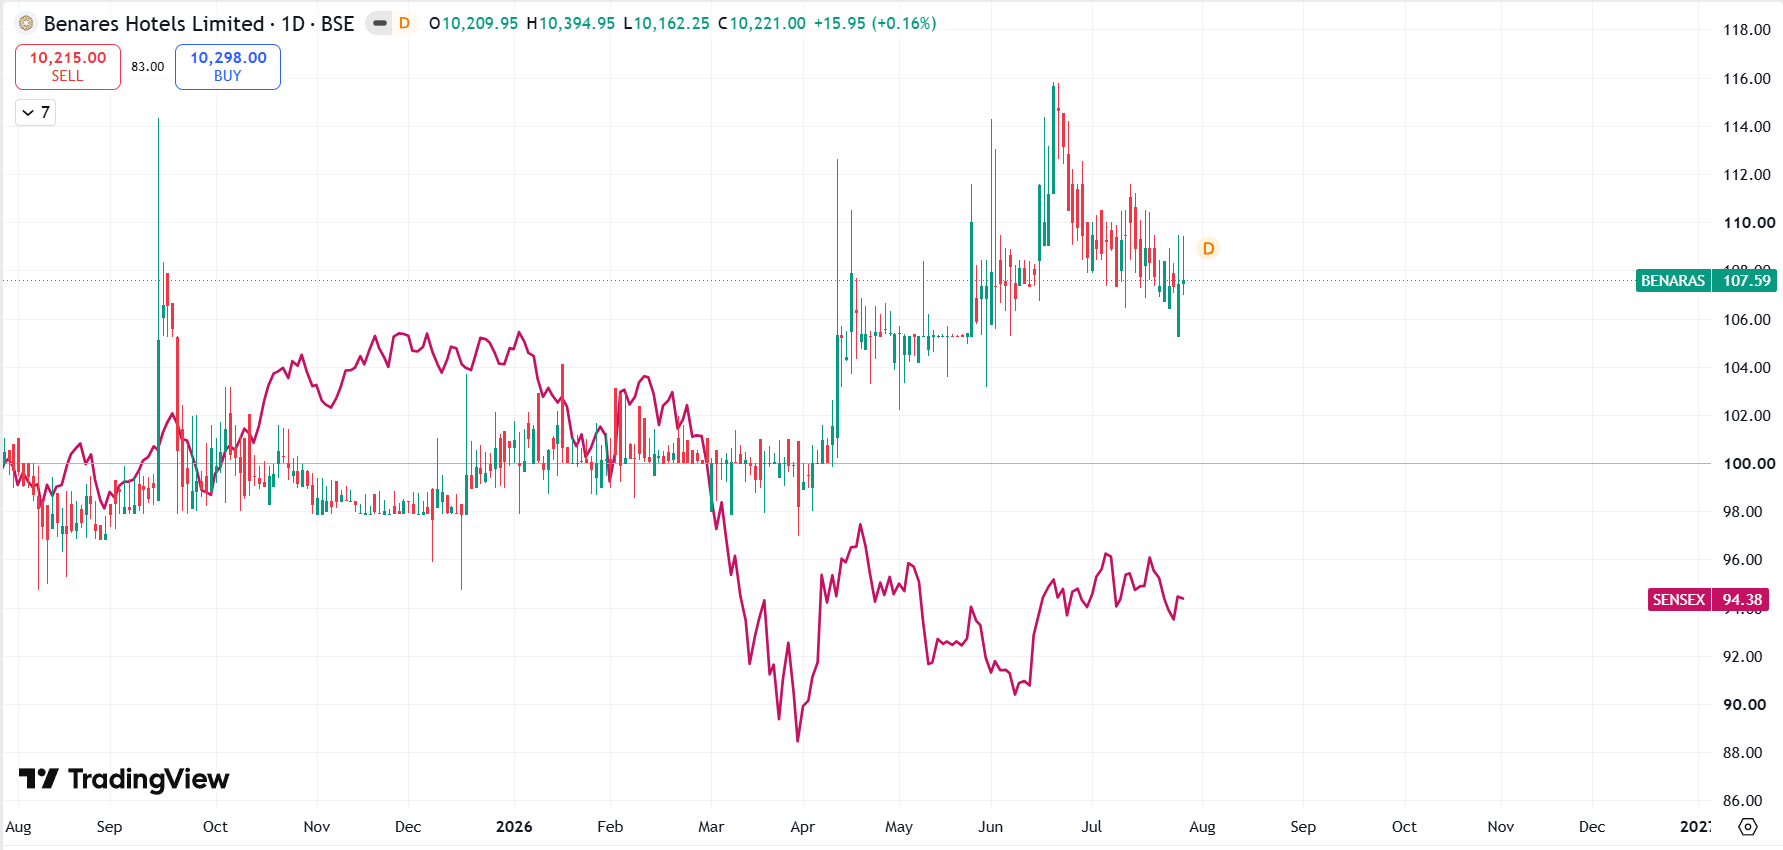
*Comparison charts are Indexed*
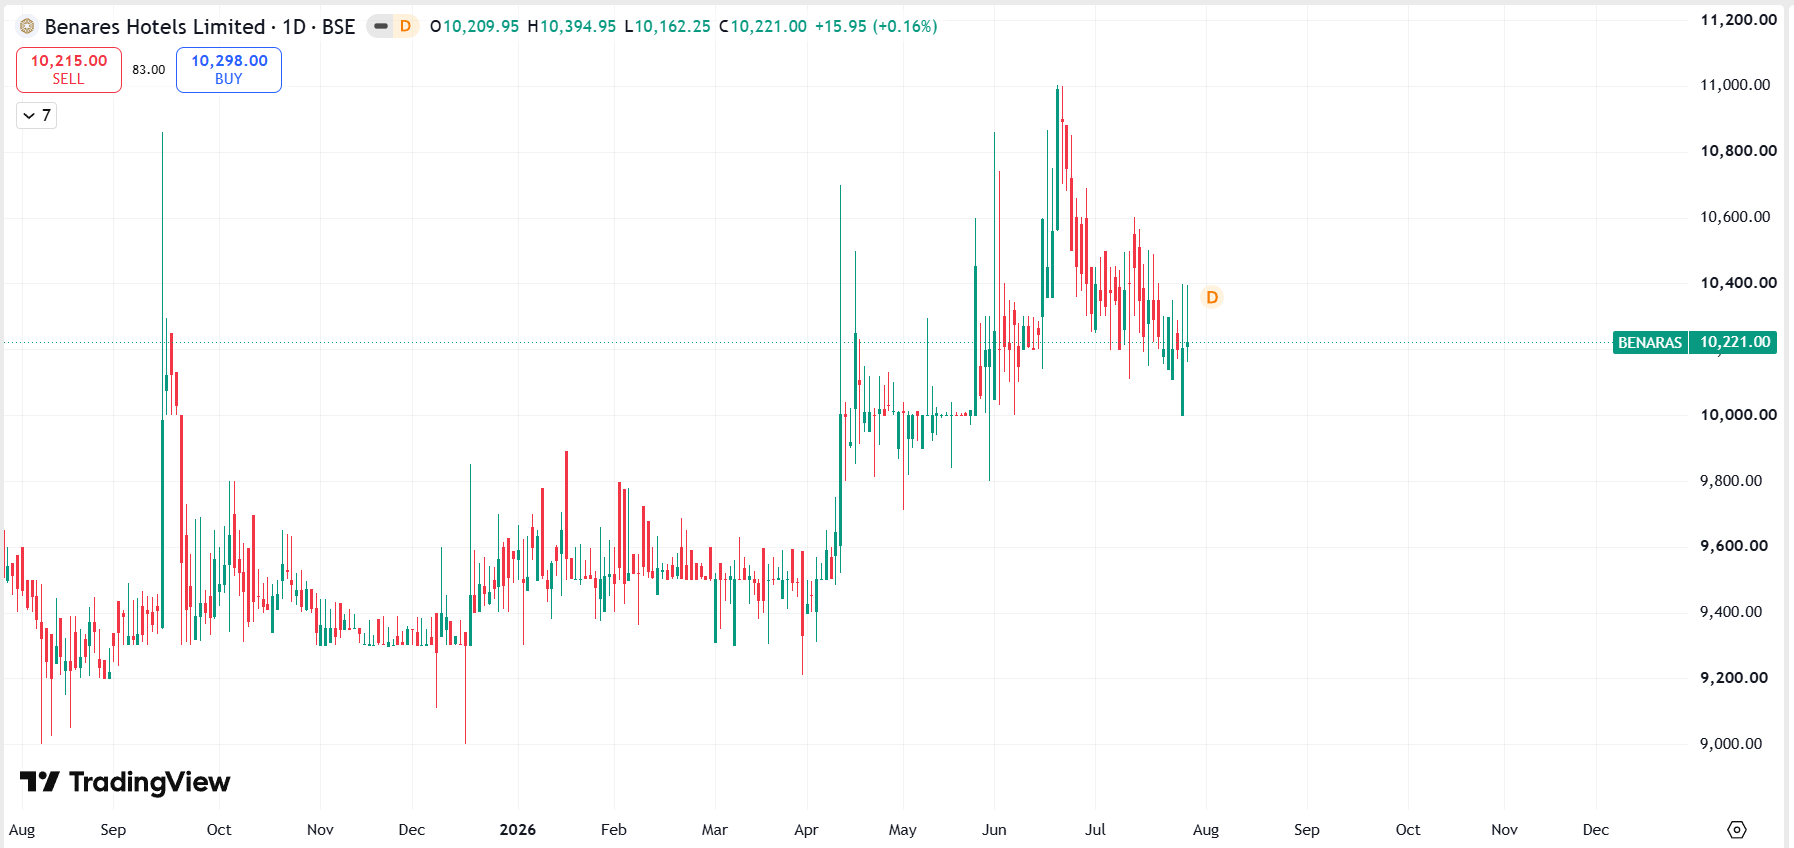
2.1 Benares Hotels Ltd. Performance:
2.2 Benares Hotels Ltd. Vs. BSESML250:
2.3 Benares Hotels Ltd. Vs. BSE SENSEX:
3. About Company:

Benares Hotels Ltd. is a Tata Group hospitality company and a subsidiary of The Indian Hotels Company Ltd. (IHCL). The company owns and operates premium hotels in India, with its portfolio comprising Taj Ganges, Varanasi; Taj Nadesar Palace, Varanasi; and Ginger Gondia, Maharashtra. It caters to leisure tourists, business travelers, weddings, conferences, and luxury hospitality guests.
The company primarily generates revenue from room bookings, food & beverage services, banquets, events, and other hospitality-related services. Leveraging the Taj brand and IHCL’s management expertise, Benares Hotels has established a strong presence in the hospitality market of Varanasi.
3.1 BUSINESS SEGMENTS:
Although the company reports a single operating segment (Hoteliering) under Ind AS, its business can be understood through the following operational verticals.
Rooms: This is the largest revenue-generating vertical of the company and includes luxury accommodation, suites, and guest rooms offered across its Taj and Ginger properties. Revenue is earned from leisure travelers, business guests, corporate bookings, and tourists.
Food & Beverage (F&B): This vertical includes restaurants, bars, in-room dining, and catering services. It serves both in-house guests and walk-in customers and is a key contributor to hotel revenues.
Banquets & Events: The company provides banquet halls, wedding venues, conferences, meetings, and event management services. This vertical caters to weddings, corporate events, exhibitions, and social gatherings.
Other Hospitality Services: This segment includes laundry services, spa and wellness (where applicable), transportation, and other guest services, enhancing the overall hospitality experience and generating ancillary revenue.
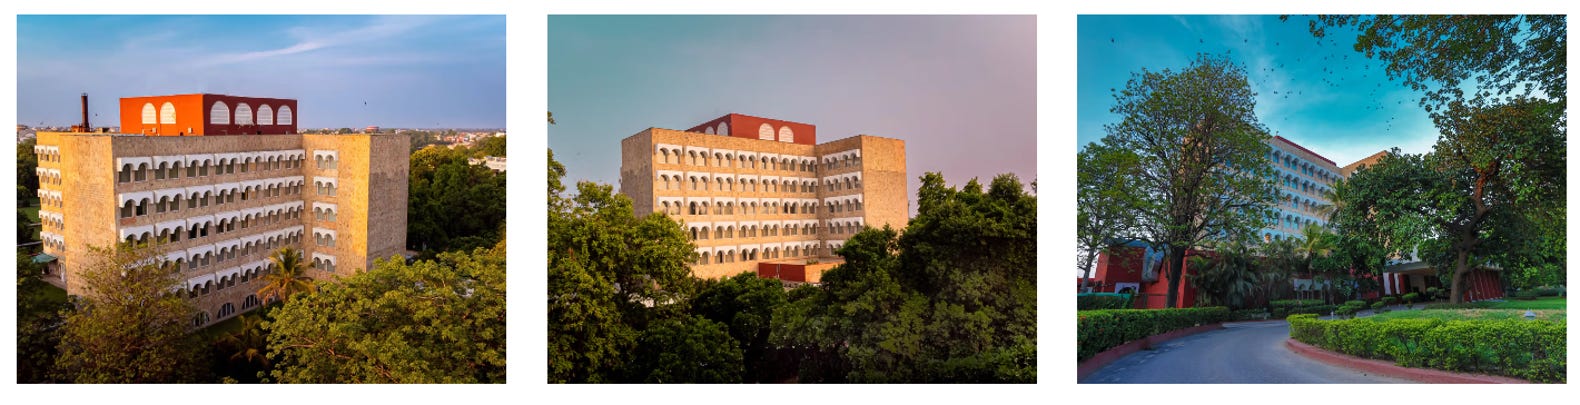
3.2 Taj Ganges Varanasi:
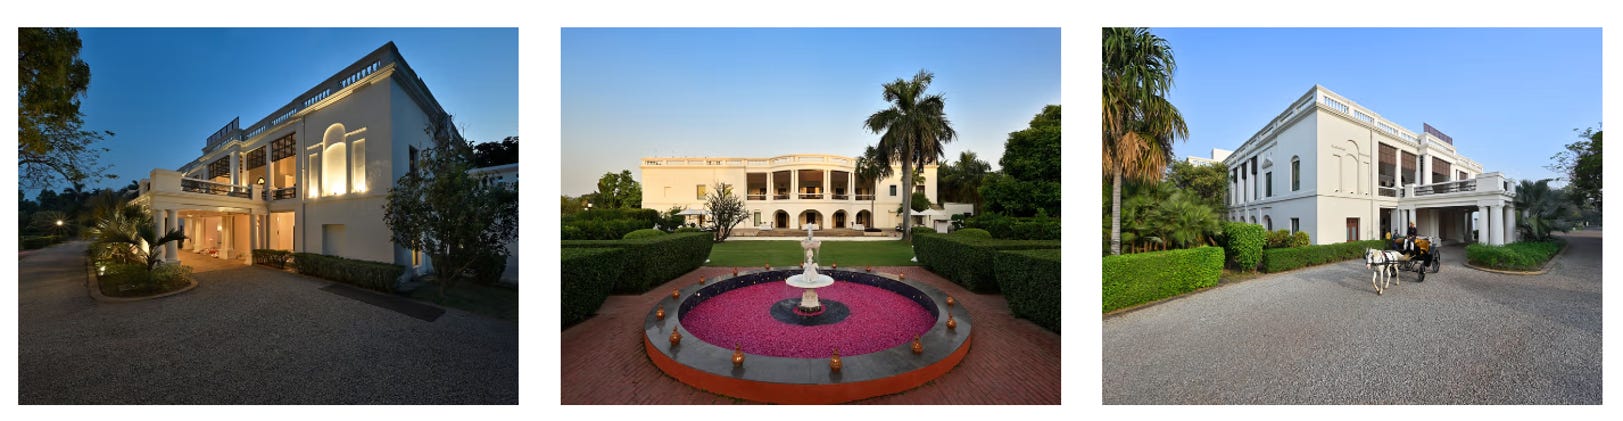
3.3 Taj Nadesar Palace, Varnasi:
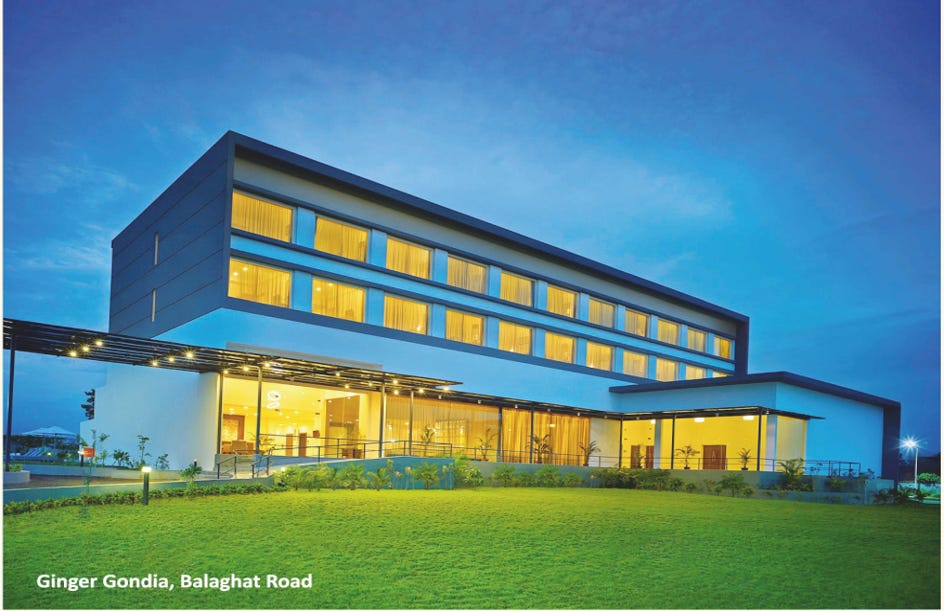
3.4 Ginger Hotel, Gondia:
4. Management Analysis:
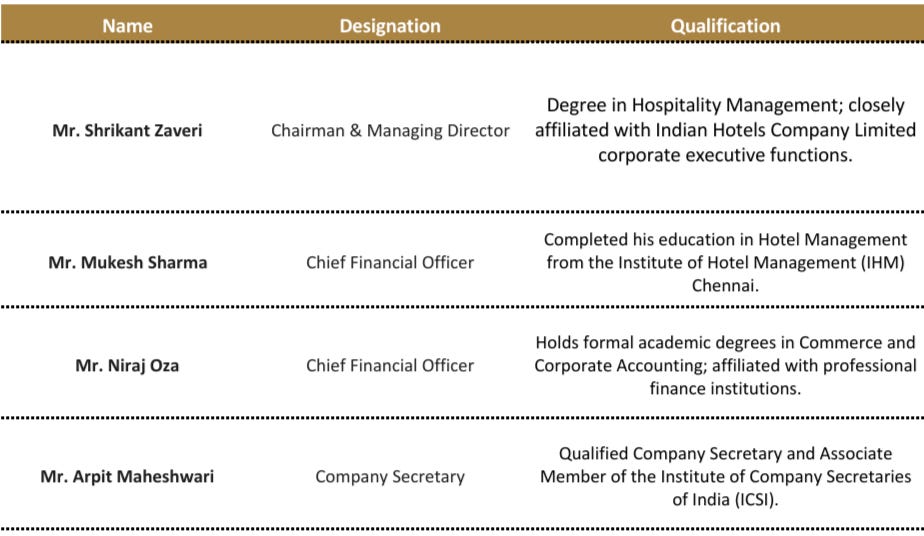
4.1 KMP’s Remuneration:
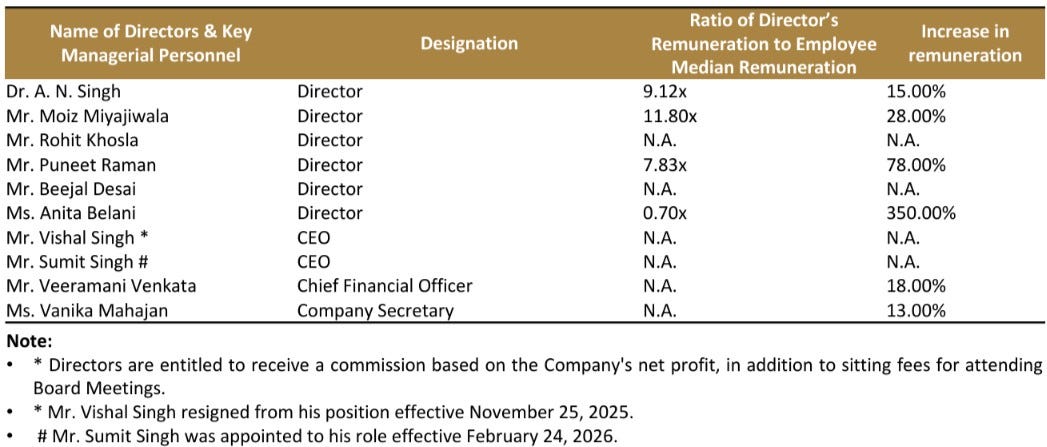
Before we move on to the Financials, we would appreciate if you could subscribe. This way we can reach out to you personally during our special offers or announcements in the future.
5.1 QUARTERLY ANALYSIS:
(Read detailed Quarterly Analysis in the Premium Version)
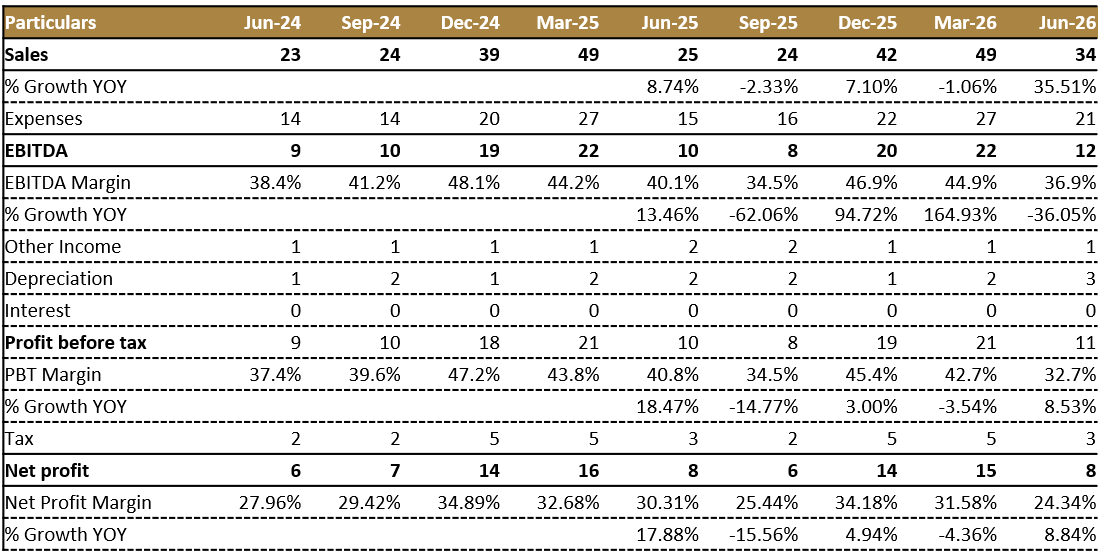
Growing at a CGR of 5% in last 9 Quarters.
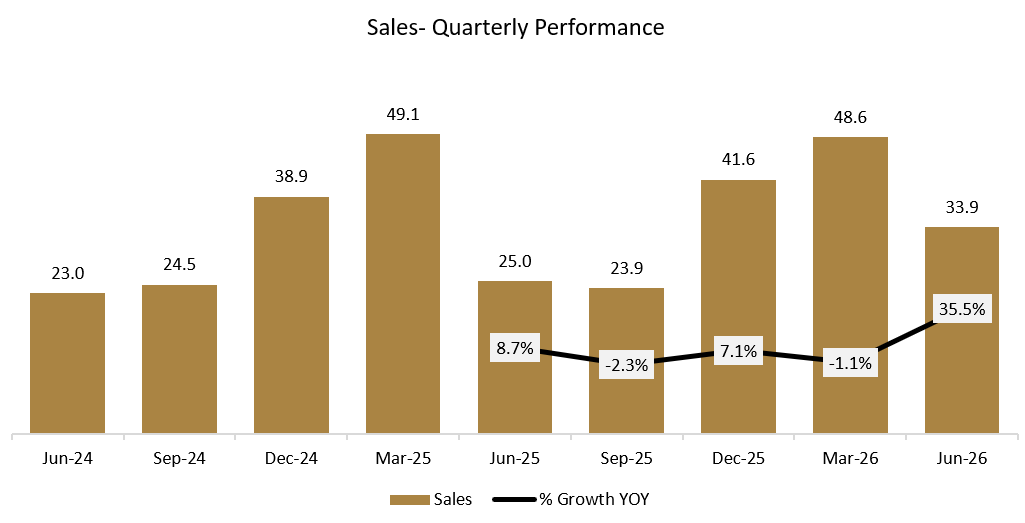
Growing at a CGR of 4.4% in last 9 Quarters.
Growing at a CGR of 3.2% in last 9 Quarters.
5.2 ANNUAL ANALYSIS:
(Read detailed Annual Analysis and Forecasts in the Premium Version)
5.2.1 Revenue:
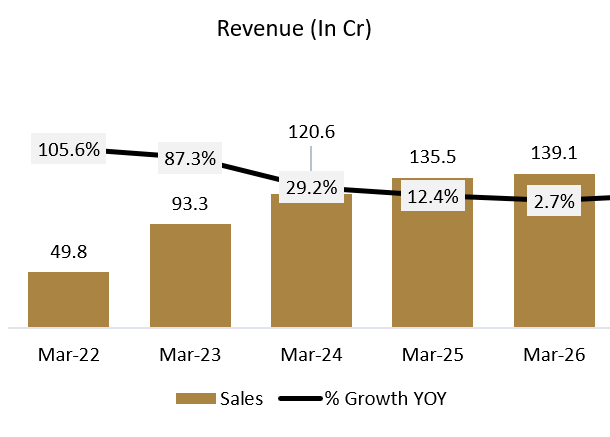
5Y CAGR: 29.3%
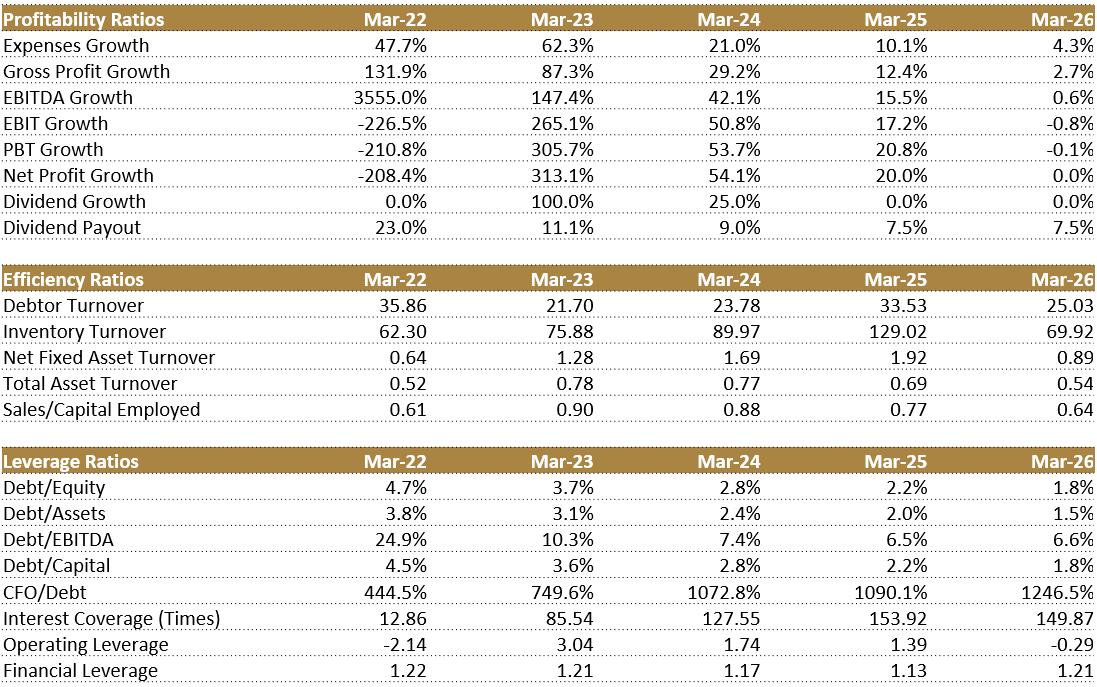
The FY23 and FY24 growth of 87.3% and 29.2% is best read against a low FY22 base, the year hotels were still working through pandemic disruption to travel. As occupancy and room rates normalized post COVID, growth naturally decelerated, first to 12.4% in FY25, then sharply to 2.7% in FY26.
The FY26 slowdown to near flat growth is worth flagging on its own. Quarterly data shows the new 100 room block at Taj Ganges only started contributing meaningfully from Q1 FY27, not during FY26 itself. So FY26 likely captures a year where the company was investing in and possibly disrupting existing operations to build out the new block, without yet getting the revenue benefit from it.
That would explain why growth nearly stalled in a year when hospitality demand in Varanasi was otherwise steady.
5.2.2 EBITDA:
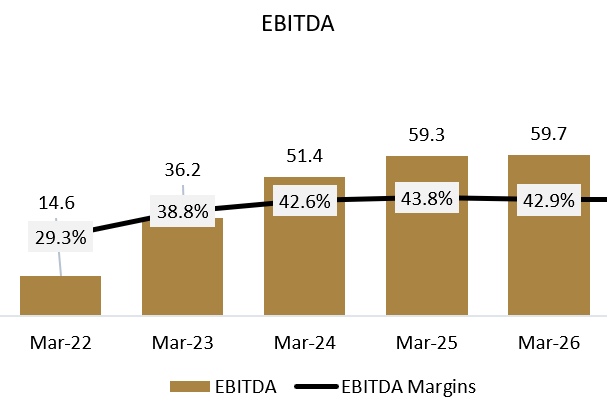
5Y CAGR: 42.1%
EBITDA margin expanded from 29.3% in FY22 to a peak of 43.8% in FY25, again tracking the post pandemic recovery in occupancy against a largely fixed cost base. FY26 shows a mild reversal to 42.9%, a small but directionally telling dip given expenses grew faster than revenue that year (4.3% versus 2.7%).
This fits the same construction phase explanation. New room additions typically bring staffing, pre-opening, and setup costs onto the books before they start generating matching revenue, which would explain a slight margin give up in FY26 even as the topline barely moved.
5.2.3 Net Profit:
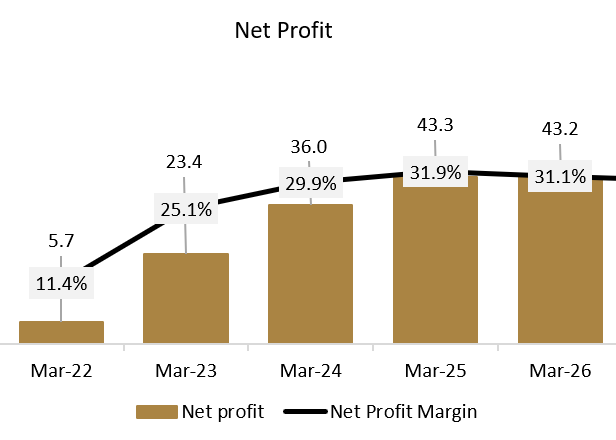
5Y CAGR: 66.2%
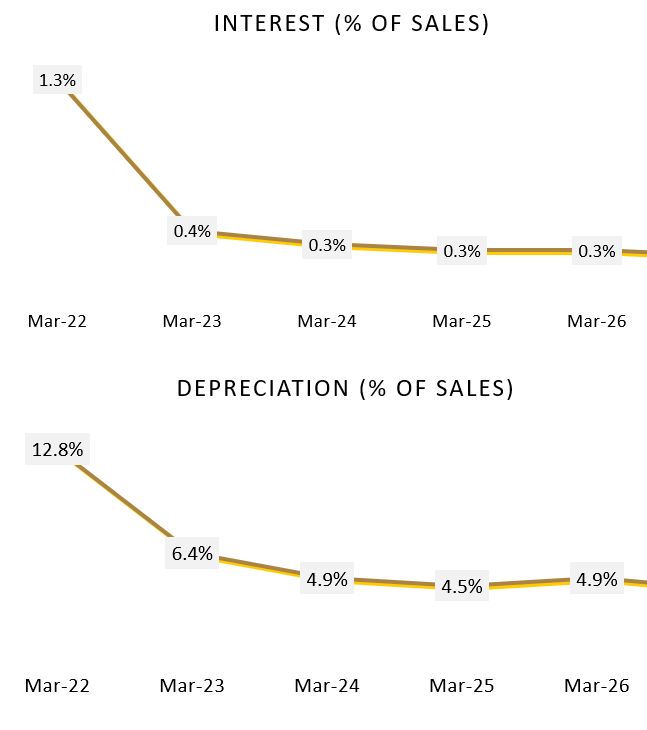
PAT growth from ₹6 cr in FY22 to ₹43 cr in FY26 has run ahead of EBITDA growth in the earlier years, largely due to interest costs falling close to zero and other income rising steadily, from 0.2% of sales in FY22 to 4.0% in FY26.
That is a meaningful and probably underappreciated detail, it suggests the company is sitting on a growing pool of surplus cash generating treasury income, which by FY26 is adding almost as much to the bottom line as a full percentage point of margin would.
PAT margin has otherwise moved in step with EBITDA margin through the period, confirming there is no separate story below the operating line beyond the other income build up.
5.2.4 Balance Sheet:
Balance sheet size and structure
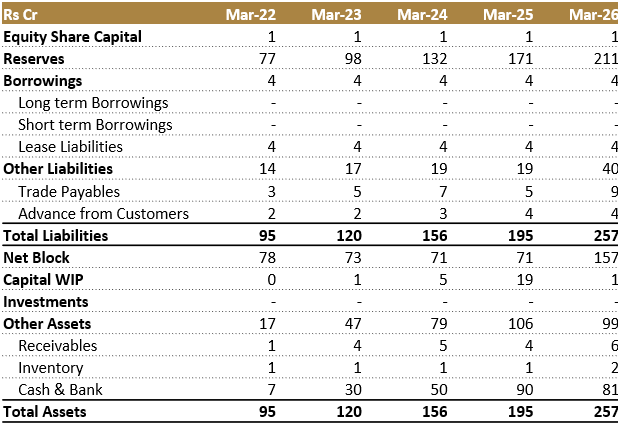
Total assets have grown from ₹95 cr in FY22 to ₹257 cr in FY26, a nearly threefold increase entirely funded through internal accruals. Reserves rose from ₹77 cr to ₹211 cr over the same period, while equity share capital stayed flat at ₹1 cr. Borrowings have remained at ₹4 cr throughout, entirely lease liabilities, with zero long term or short term debt on the books at any point in five years.
This is a business that has scaled its asset base by nearly three times without taking on a rupee of financial leverage.
Capex cycle and asset composition
The capex story is now confirmed rather than inferred. Property, plant and equipment jumped from ₹69.2 cr to ₹155.5 cr in FY26, while Capital WIP fell from ₹18.9 cr to ₹0.8 cr, marking completion and capitalisation of the new room block at Taj Ganges.
A meaningful part of this addition was funded not by cash outflow but by creditors for capital expenditure, which rose from ₹1.3 cr to ₹15.9 cr within Other financial liabilities, including ₹2.8 cr payable to MSME vendors. This explains why cash reserves did not fall in step with the size of the asset addition.
Working capital
Trade receivables rose from ₹4.0 cr to ₹5.6 cr, growth of roughly 37%, notably faster than the 2.7% revenue growth for the year. This gap is worth watching. It could reflect a shift toward more corporate or institutional billing, such as the BRICS delegation hosting during the year, which typically comes with longer settlement cycles than retail or walk in guests.
Trade payables also rose, from ₹4.9 cr to ₹8.7 cr, partly tracking the capex ramp up and partly ongoing operations.
Advance from customers
This sits under Other Current Liabilities as Advances collected from customers, and has moved only narrowly across the two years, from ₹3.8 cr in FY25 to ₹4.1 cr in FY26, an increase of roughly ₹0.3 cr.
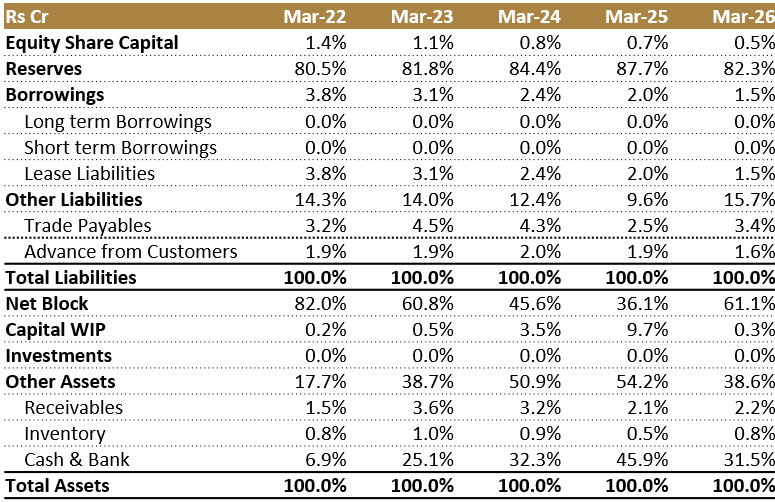
As a share of the balance sheet this is a small, slow-moving line, not a growing working capital lever, and it has stayed in this narrow range even as the asset base and revenue grew several times over across the five-year period.
In a hotel business, this line typically represents deposits collected against forward bookings, corporate room blocks, and banquet or event reservations. This is particularly relevant here given Taj Nadesar Palace’s positioning for weddings and large events in Varanasi, a segment where deposits are commonly collected well ahead of the actual event date, sometimes months in advance.
The fact that this balance has barely moved despite revenue nearly tripling over five years suggests one of a few things. Either advance collection policies have stayed conservative and unchanged through this growth, or a rising share of bookings, particularly the transient leisure and business traveller segment, are being confirmed closer to the stay date rather than paid for well in advance. It could also mean the event and banquet segment, where deposits are more customary, has not grown as a proportion of the overall business even as room revenue expanded.
5.2.5 Common-Size Balance Sheet:
5.2.6 Cash Flow Analysis:
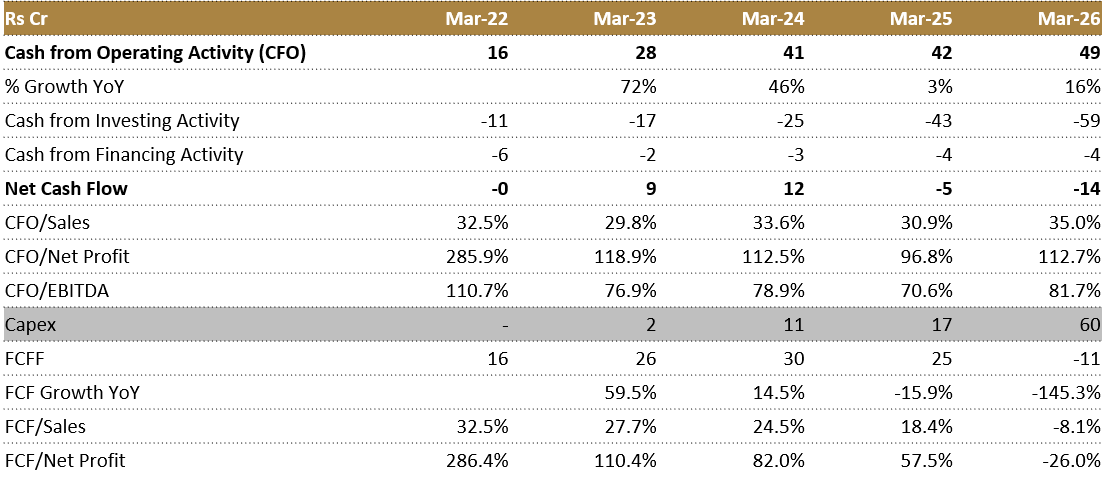
Cash from Operating Activity (CFO)
CFO has grown steadily from ₹16 cr in FY22 to ₹49 cr in FY26, broadly tracking the rise in profit from operations. The gap between profit from operations and CFO has widened in recent years. In FY22 the two were nearly identical (₹15 cr profit versus ₹16 cr CFO), but by FY26 profit from operations stood at ₹60 cr against CFO of ₹49 cr, a gap of ₹11 cr. This gap is fully explained by direct taxes paid, which rose from just ₹1 cr in FY22 to ₹13 cr in FY26, growing faster than profit itself.
This is consistent with the company moving off any earlier tax shelters or exemptions and settling into a fuller cash tax rate as profitability scaled. Working capital changes have stayed small and non-directional through this period, so they are not the driver of the CFO to profit gap, taxes are.
Cash from Investing Activity (CFI)
Cash outflow on fixed asset purchases jumped to ₹60 cr in FY26, against just ₹17 cr the year before, more than the combined capex of the previous four years (FY22 to FY25) put together. This is the cash paid out for the room block at Taj Ganges. Net Block on the balance sheet rose by ₹86 cr, more than the ₹60 cr actually paid in cash, confirming that a meaningful part of the capex, the creditors for capital expenditure found in the notes, was funded on credit rather than cash outflow in the same year.
Other investing items, which typically capture placement of surplus cash into fixed deposits, swung from an outflow of ₹30 cr in FY25 to just ₹5 cr in FY26. The company appears to have redirected cash that would otherwise have gone into fresh deposits toward funding capex instead, which is also why the fixed deposit balance on the balance sheet grew only marginally in FY26 rather than in line with prior years. Interest received has climbed steadily, from ₹0 cr in FY22 to ₹6 cr in FY26, tracking the growing treasury income already visible in other income on the P&L.
Cash from Financing Activity (CFF)
This section has stayed quiet and consistent, entirely dividend driven. Outflow has ranged ₹2 cr to ₹6 cr across the last five years, with dividends paid settling around ₹3.25 cr in both FY25 and FY26. There have been no borrowings drawn and none repaid in any of the last five years, reconfirming the debt free character of the balance sheet even through a large capex cycle.
6. Key Ratios:
7. Shareholding Pattern:
You know, we have 3 Tiers to Our Offerings:
I am just starting out! – ₹999/month (Monthly Plan)
I know what I am doing! – ₹2,699/quarter (~₹899/month, Best Value)
I want to create wealth – ₹11,999/year (~₹999/month, Plus You get all access to all reports prepared till date)
You can start with any and can upgrade in between with no additional charges.
To know more, you can reach out to us at:
Email: team@equityedgereaearch.in
Ph No: +91 88590 79630
Please Continue….
8. Con-Call Analysis
No Con-Call provided.
9. SWOT ANALYSIS:
Strengths
Significant Capacity Expansion: Added 100 rooms at Taj Ganges, increasing capacity by 77% to 230 keys and enabling larger group, MICE, and wedding bookings.
Strong Brand Legacy: Backed by 55 years of hospitality experience and IHCL’s Taj brand, providing access to global reservations, loyalty programs, and standardized operations.
Diversified Hotel Portfolio: Operates across luxury (Taj Nadesar Palace), upscale (Taj Ganges), and midscale (Ginger Gondia) segments, catering to varied customer profiles.
Proven Event Execution: Successfully hosted high-profile events like the BRICS delegation, showcasing strong capabilities in managing diplomatic and high-security events.
Weaknesses
High Geographic Concentration: Most of the premium room inventory is concentrated in Varanasi, increasing exposure to location-specific risks.
Dependence on Taj Ganges: The expanded Taj Ganges now accounts for the majority of the company’s upscale capacity, making operations highly reliant on a single property.
Heavy Contract Workforce: Nearly 60% of employees are contractual or temporary, creating challenges in service consistency and workforce management.
Leadership Transition Risks: Recent CEO changes may temporarily impact strategic execution and operational continuity.
Opportunities
Growth in MICE and Weddings: The larger room inventory enables the company to target high-value conferences, corporate events, and destination weddings.
Tourism Infrastructure Boost: Improved airport, rail, and road connectivity in Varanasi is expected to drive higher domestic and international tourist arrivals.
Operational Efficiency Through SAP: SAP S/4HANA implementation can improve procurement, inventory management, and operational efficiencies across properties.
Higher Ancillary Revenues: Increased in-house guest traffic creates opportunities to boost spending on restaurants, banquets, bars, spas, and other hospitality services.
Threats
Seasonality in Tourism: Demand remains highly seasonal, with weaker occupancy and F&B revenues during the summer months.
Festival-Related Operational Risks: Large religious gatherings increase crowd management, infrastructure, and safety challenges in Varanasi.
Rising Competitive Supply: New hotel developments in Varanasi could intensify competition and pressure occupancy and room rates.
International Travel Uncertainty: Geopolitical tensions and travel advisories could reduce foreign tourist arrivals, particularly impacting the luxury segment.
10. Competitors:
10.1 Royal Orchid Hotels Ltd.
Market Cap: ₹ 876 Cr.
Royal Orchid Hotels Ltd., headquartered in Bengaluru, Karnataka, operates in the Hospitality Industry. The company owns, manages, and operates a portfolio of upscale, upper mid-scale, and business hotels under brands such as Royal Orchid, Regenta, Regenta Place, and Regenta Resort, catering to business and leisure travelers across India.
Business Model:
Royal Orchid follows an asset-light hospitality model, with a significant portion of its hotels operating under management contracts and lease agreements.
The company generates revenue through:
Room rentals.
Food & beverage (restaurants and banquets).
Meetings, Incentives, Conferences & Exhibitions (MICE).
Hotel management and franchise fees.
It serves corporate travelers, leisure tourists, weddings, and events, with a growing presence across Tier-I, Tier-II, and leisure destinations.
What Sets Them Apart:
Asset-Light Expansion: Focus on management contracts enables faster growth with lower capital requirements.
Diversified Hotel Portfolio: Presence across business, leisure, and resort segments.
Pan-India Presence: Operates hotels across major cities and tourist destinations.
Strong Corporate & MICE Focus: Well-positioned to benefit from business travel and event demand.
10.2 Kamat Hotels (India) Ltd.
Market Cap: ₹ 492 Cr.
Kamat Hotels (India) Ltd., headquartered in Mumbai, Maharashtra, operates in the Hospitality Industry. The company owns, operates, and manages hotels and resorts under brands such as The Orchid, Fort JadhavGADH, Lotus Resorts, and IRA by Orchid, catering to business, leisure, and MICE travelers across India.
Business Model:
Kamat Hotels follows a hotel ownership and management model, generating revenue from owned, leased, and managed properties.
Revenue is generated through:
Room rentals.
Food & beverage (restaurants and banquets).
Meetings, Incentives, Conferences & Exhibitions (MICE).
Hotel management and franchise services.
The company has a strong presence in the mid-premium and upscale hospitality segment, with a growing portfolio across business and leisure destinations.
What Sets Them Apart:
Strong Brand Portfolio: Operates well-known brands including The Orchid, India’s first Ecotel-certified luxury hotel brand.
Eco-Friendly Positioning: Pioneer in sustainable and environmentally responsible hospitality.
Diversified Hotel Portfolio: Presence across business hotels, resorts, and heritage properties.
Growing Asset-Light Strategy: Increasing focus on management contracts and franchising.
10.3 Juniper Hotels Ltd.
Market Cap: ₹ 4,336 Cr.
Juniper Hotels Ltd., headquartered in Mumbai, Maharashtra, operates in the Hospitality Industry. The company owns and develops luxury and upscale hotels, primarily under the Hyatt brand, including Grand Hyatt, Hyatt Regency, Hyatt Place, and Andaz, catering to business, leisure, and MICE travelers across India.
Business Model:
Juniper Hotels follows a hotel ownership and asset-management model, with properties operated under long-term brand agreements with Hyatt.
Revenue is generated through:
Room rentals.
Food & beverage (restaurants, bars, and banquets).
Meetings, Incentives, Conferences & Exhibitions (MICE).
Events, weddings, and other hospitality services.
The company benefits from a portfolio of premium hotels located in major business and tourism destinations.
What Sets Them Apart:
Strategic Partnership with Hyatt: One of the largest owners of Hyatt-branded hotels in India.
Premium Hotel Portfolio: Focus on luxury and upscale hospitality.
Prime Locations: Hotels located in key metro cities and high-demand destinations.
Strong MICE & Corporate Presence: Well-positioned to benefit from business travel, conferences, and large events.
Thank You So Much For Reading!!
Researched By- Naresh, Mayank and Vaibhav
All information is sourced from the company’s annual reports, Press Release, News Articles, GoIndiastocks.in, Screener.in, industry reports, and Economy Outlook reports.
Disclaimer: We do not recommend buying or selling any stock. You should consult your financial advisor before buying or selling any financial instrument.