


Hey Folks, here at EquityEdge Research, we make Small-Cap Investing easy for you by Backing you up with Robust & Full-Fledged Research.
Yes, we do use AI in our articles, but only to create a structure. We fact check and write the drafts on our own. If you find anything that seems suspicious/ erroneous, please feel free to comment below the article.
Please fill the form below if you are interested to know and would like a Free Sample Report showcasing what we offer in our Premium Services!
Check out our Previous Report here:

Let’s Go!
Table of Contents:
Key Highlights.
Company Price Chart Analysis.
About the Company.
Management Analysis.
Financial Analysis
Ratio Analysis.
Shareholding Analysis.
SWOT Analysis.
Competitors.
Premium (Includes Free):
Global Infrastructure and Engineering Industry.
Indian Infrastructure and Engineering Industry.
Financial Analysis- Quarterly.
Segment Wise Data.
Competitive Analysis- Bio & Financials.
Daily Share price trend TTM- Peer comparison.
1. Key Highlights:
FY26
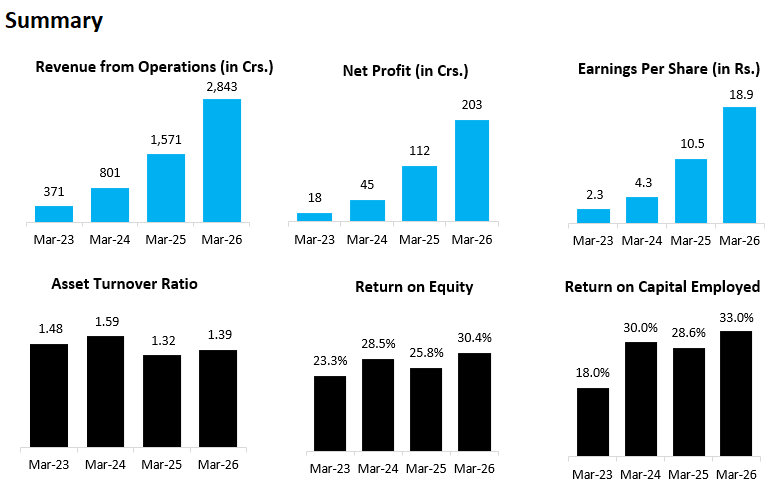
REVENUE: ₹ 2,843 Cr. (+80.97% YoY)
EBITDA: ₹ 327 Cr. (+86.86% YoY)
EBITDA MARGIN: 11% (No Change)
PAT: ₹ 211 Cr. (+83.48% YoY)
Q1FY27
REVENUE: ₹ 692 Cr. (-24.29% QoQ, +24.01% YoY)
EBITDA: ₹ 78 Cr. (-18.75% QoQ, +20% YoY)
EBITDA MARGIN: 11% (-100 in YoY)
PAT: ₹ 54 Cr. (-14.29% QoQ, +28.57% YoY)
OTHER HIGHLIGHTS:
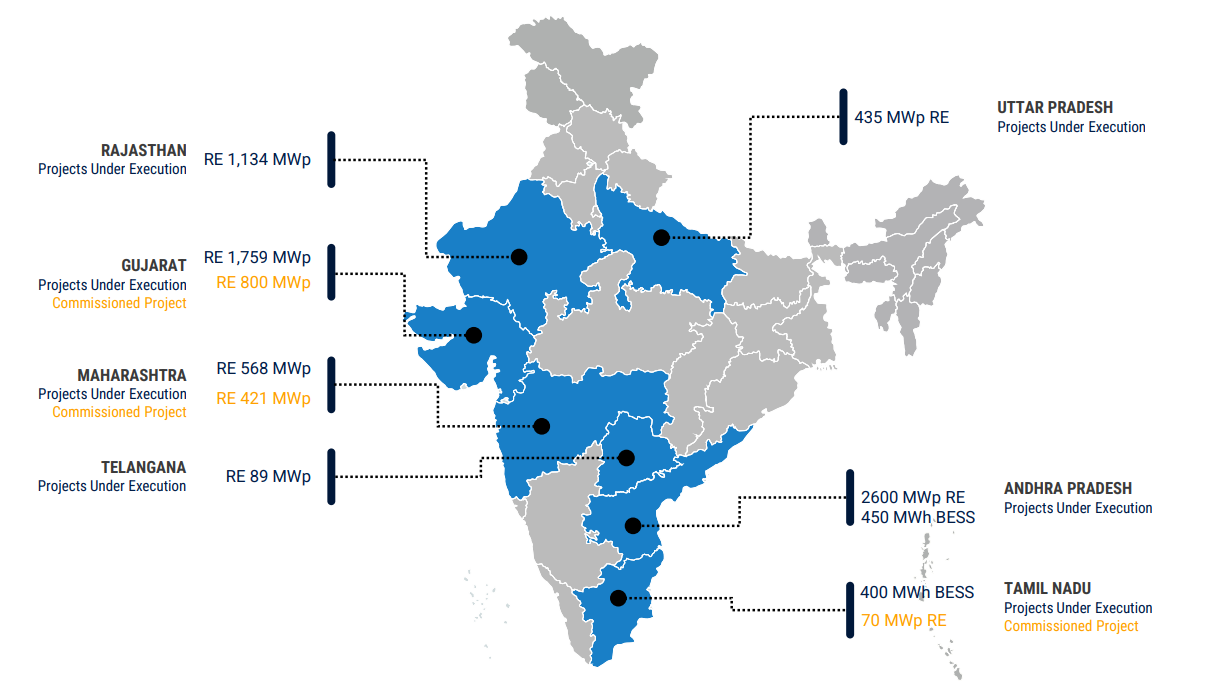
Solar EPC: Commissioned 492 MWp in FY26, taking cumulative commissioned capacity to ~1.3 GWp.
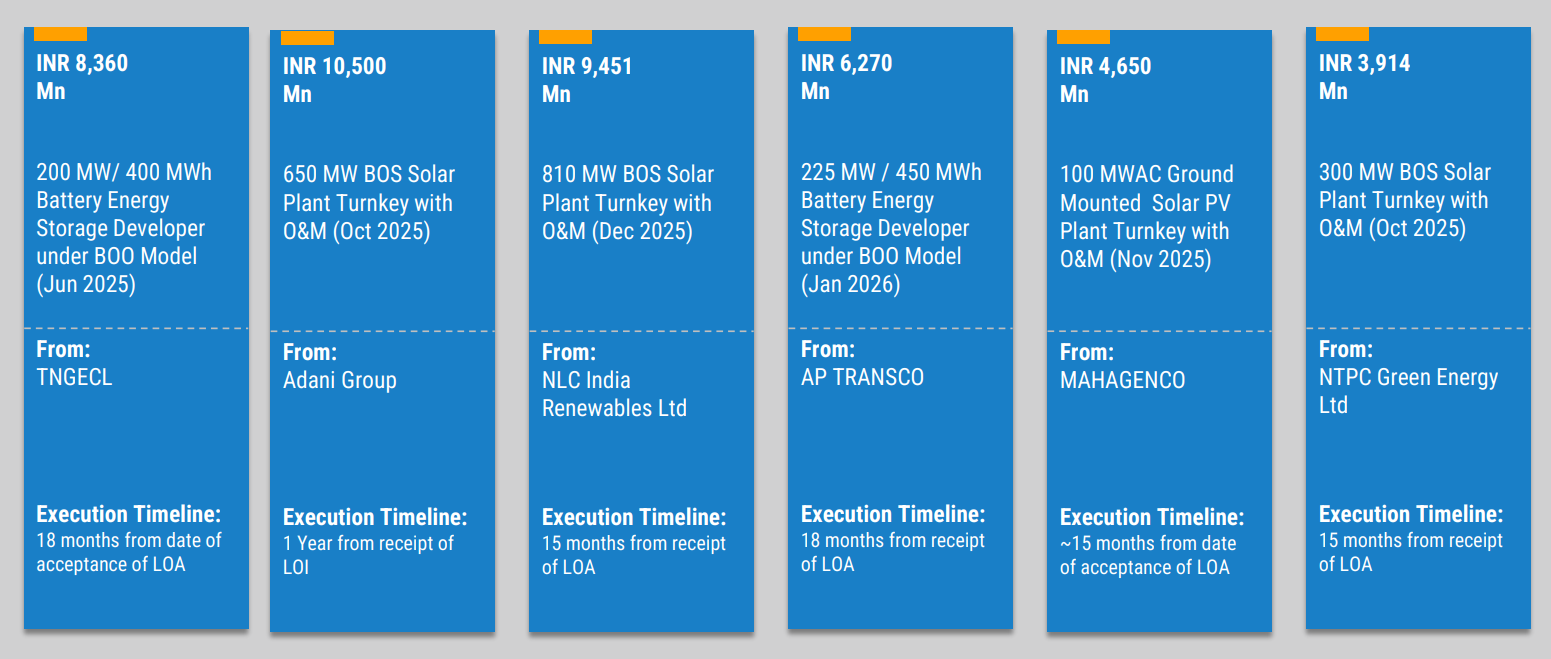
BESS Orders: Secured two large Battery Energy Storage System (BESS) orders under the BOO model from TNECL and AP TRANSCO.
Defence Sector Entry: Secured first defence order from Bharat Electronics Ltd (BEL) for critical components in March 2026.
AP 2GW IPP Project: Orders worth ₹90,000 Mn (not included in total order book) for the Andhra Pradesh solar project.
Order Book Breakdown:
Renewable Energy (Solar EPC & IPP): ₹45,367 Mn
BESS: ₹14,630 Mn
Telecom: ₹7,854 Mn
Indian Railways (Kavach infra): ₹1,930 Mn
Products (AAC Blocks, Towers, etc.): ₹1,688 Mn
Top States: Maharashtra (₹15,660 Mn), Gujarat (₹15,508 Mn), Tamil Nadu (₹10,009 Mn).
2. Company Price Chart Analysis:
*Comparison charts are Indexed*
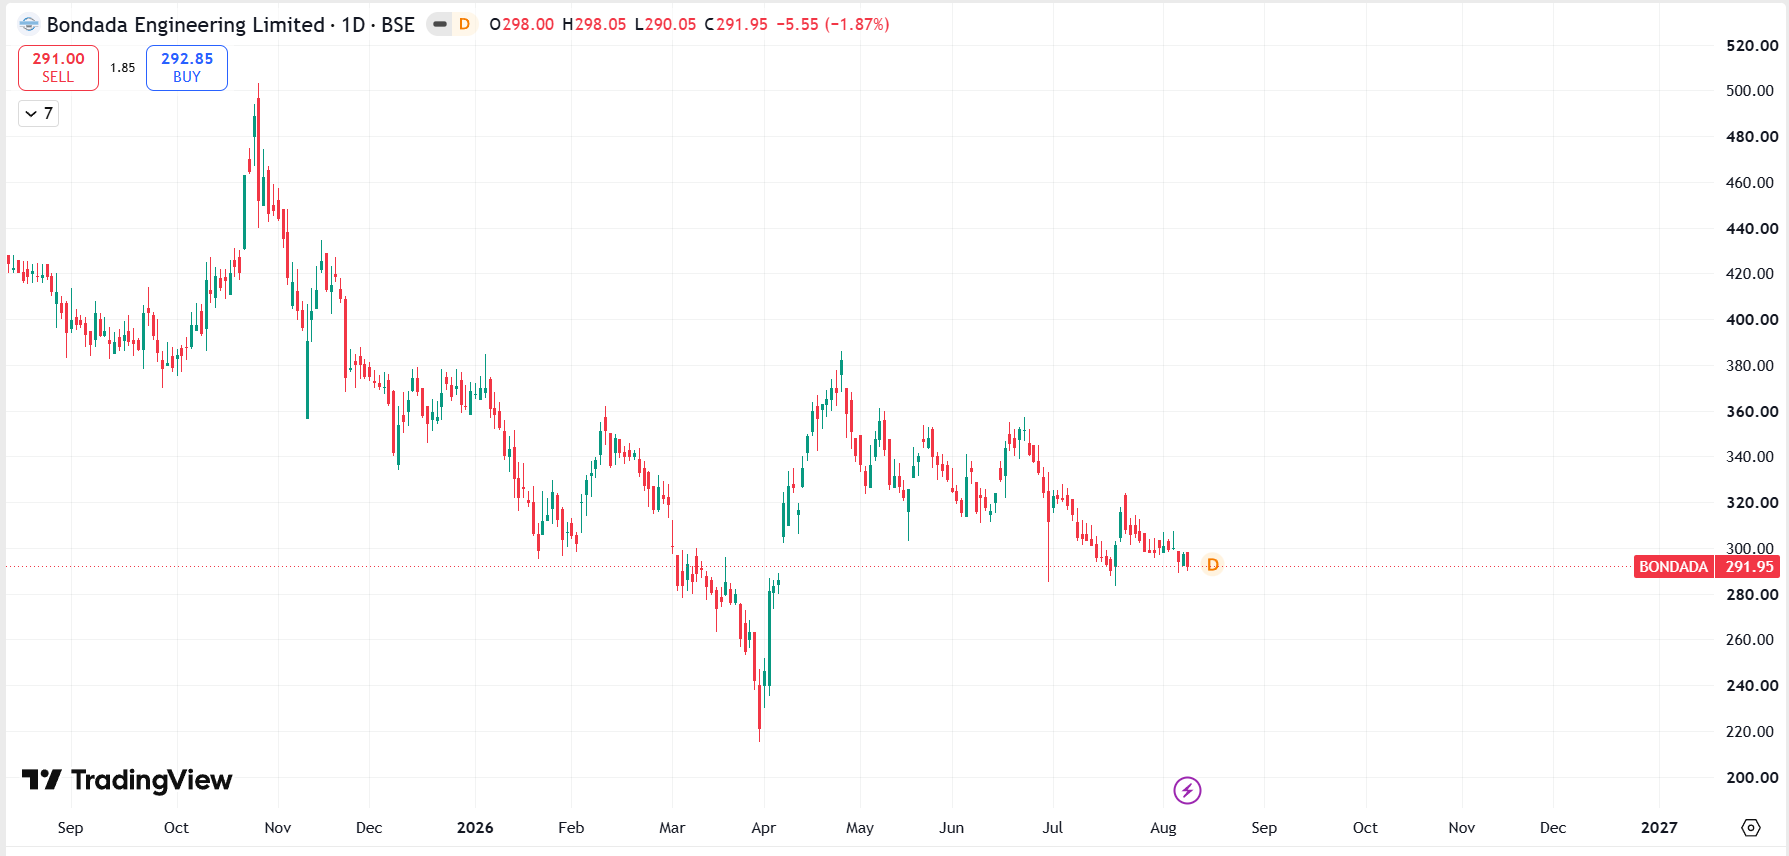
2.1 Bondada Engineering Ltd. Performance:
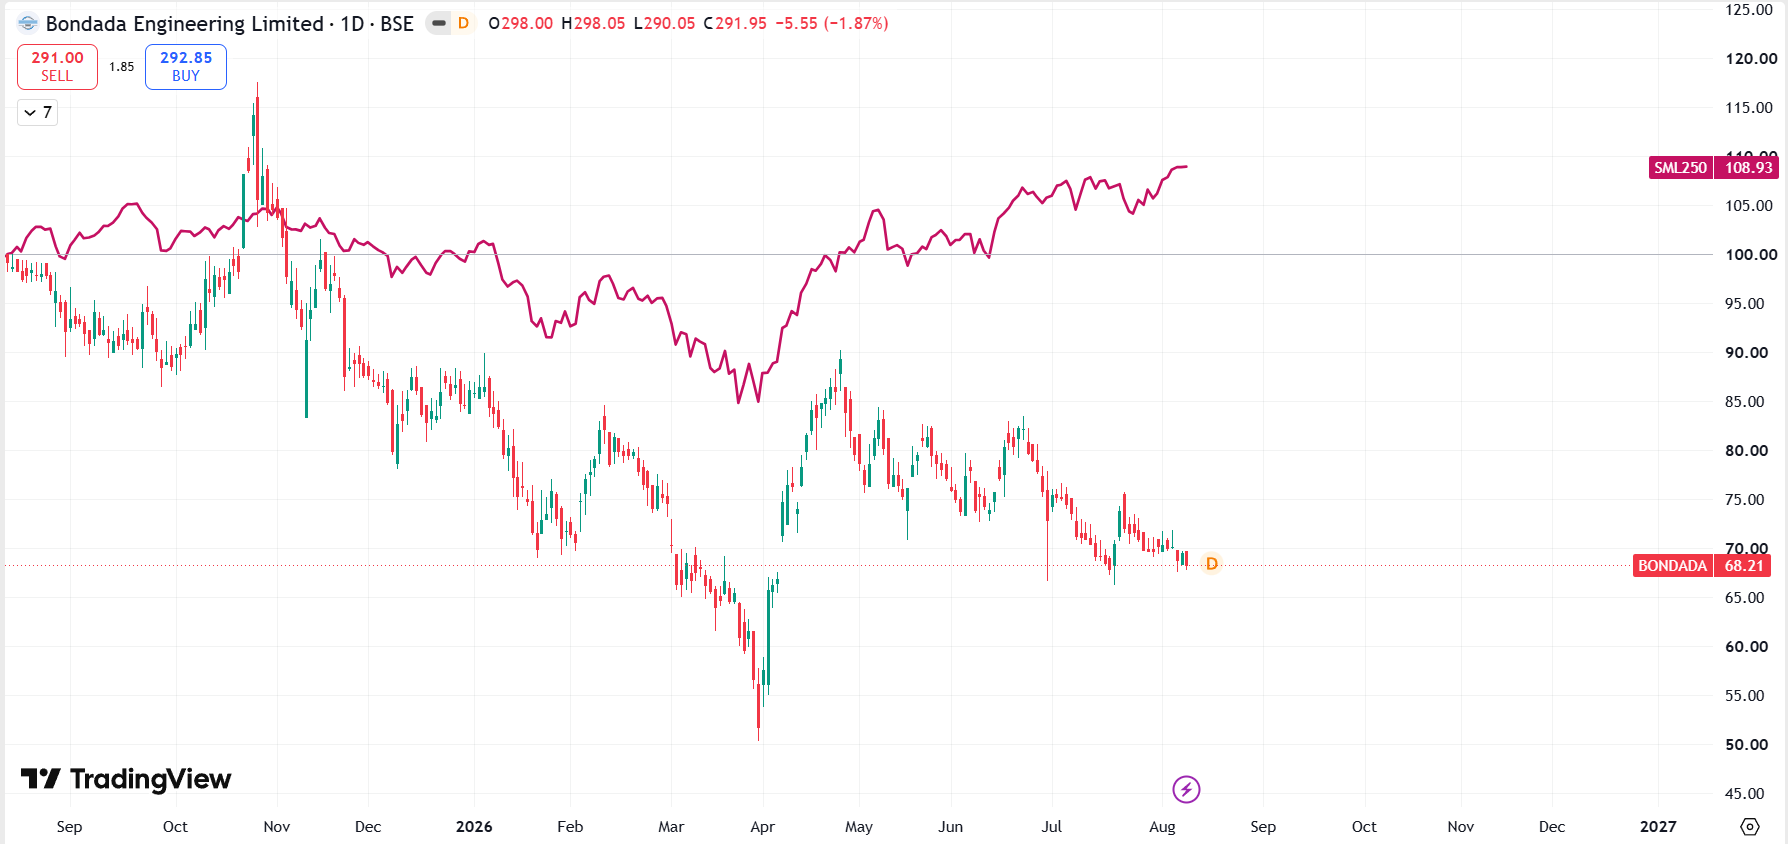
2.2 Bondada Engineering Ltd. Vs. BSESML250:
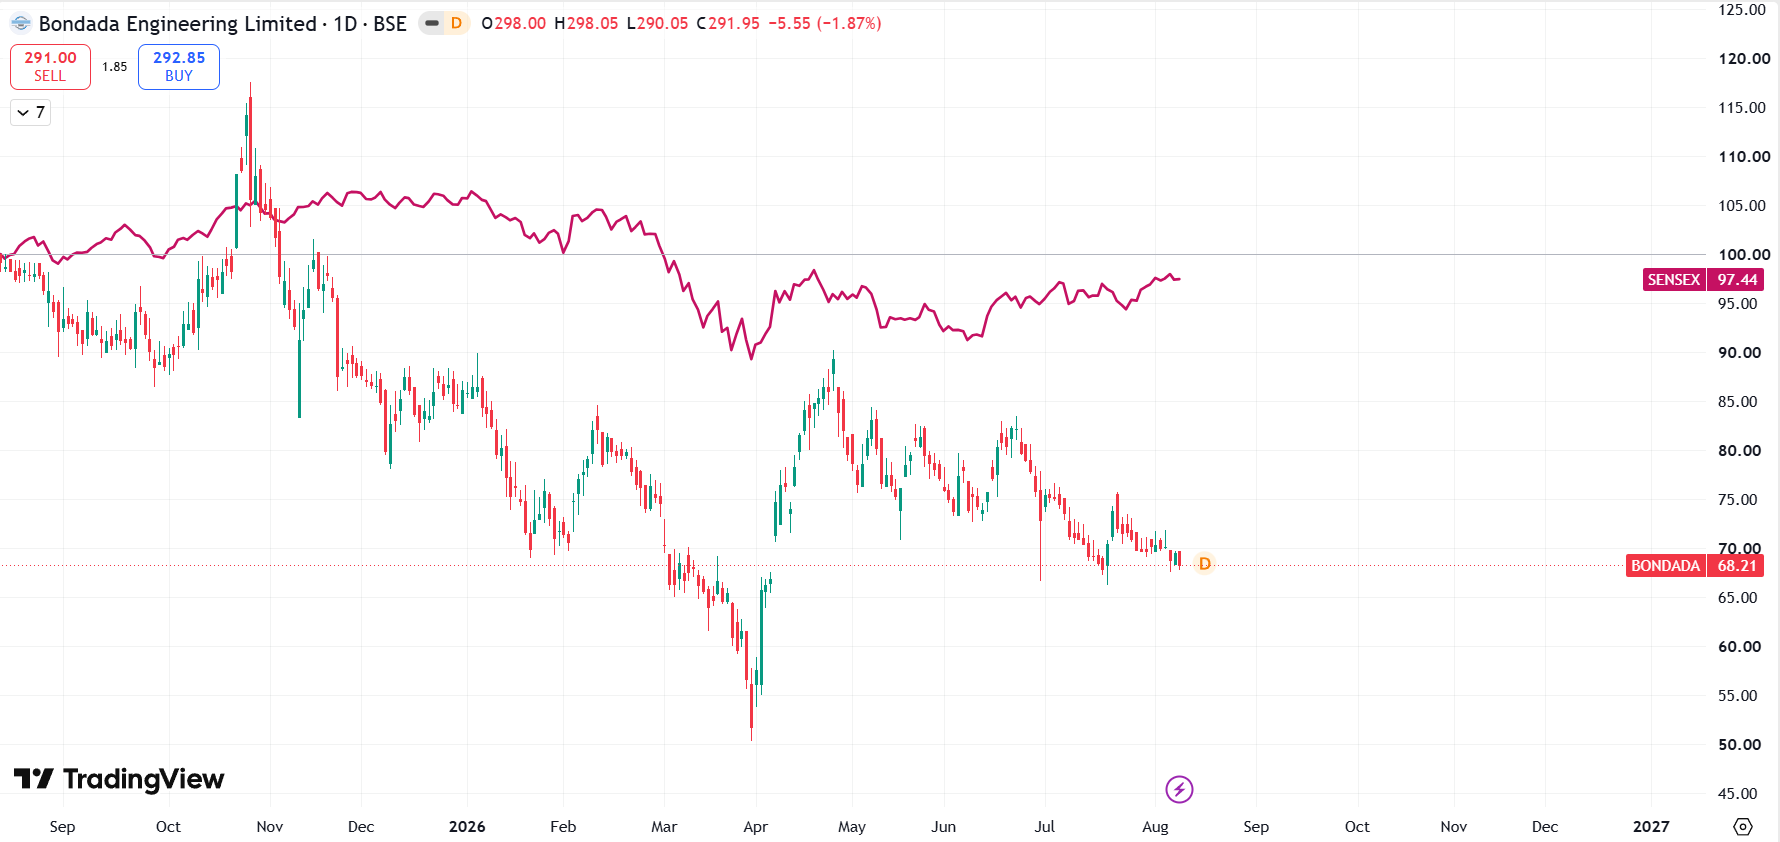
2.3 Bondada Engineering Ltd. Vs. BSE SENSEX:
3. About Company:
Bondada Engineerig Ltd. is an integrated infrastructure solutions company that provides Engineering, Procurement and Construction (EPC) and Operations & Maintenance (O&M) services. The company initially built its business around telecom infrastructure but has expanded significantly into renewable energy, railways, battery energy storage and infrastructure products. In FY26, renewable energy accounted for roughly 79% of revenue, making it the company’s dominant business area.
3.1 BUSINESS SEGMENTS:
The company can broadly be understood through three key business segments: Renewable Energy, Telecom and Products, while Railways and newer businesses such as BESS are emerging areas of expansion.
1. Renewable Energy: The Renewable Energy segment focuses primarily on solar power project development and EPC services. Bondada provides end-to-end solutions covering project design and engineering, site development, procurement, installation, electrical works, commissioning and long-term operations and maintenance. The company has also expanded into solar IPP and Battery Energy Storage Systems (BESS), making renewable energy the company’s largest and most important growth segment.
2. Telecom: The Telecom segment focuses on building and maintaining passive telecom infrastructure for telecom operators and infrastructure companies. Its activities include telecom tower construction and erection, cell-site development, optical fibre cable (OFC) infrastructure and related civil, electrical and mechanical works. Bondada also provides O&M services to maintain telecom towers and OFC networks and ensure their continued operational performance.
3. Products: The Products segment focuses on the manufacturing and supply of infrastructure-related products used across telecom, renewable energy and construction applications. This includes telecom towers, solar module mounting structures and other construction and electrical products. The company is gradually developing this business to complement its EPC operations and increase its presence across the infrastructure value chain.
4. Railways: Railways is an emerging business area for Bondada, where the company is expanding beyond its traditional telecom and solar activities. It focuses on railway signalling and related infrastructure solutions, including projects associated with modern railway communication and safety systems. The company has also developed Kavach-related ground infrastructure, supporting the deployment of railway safety and signalling infrastructure.
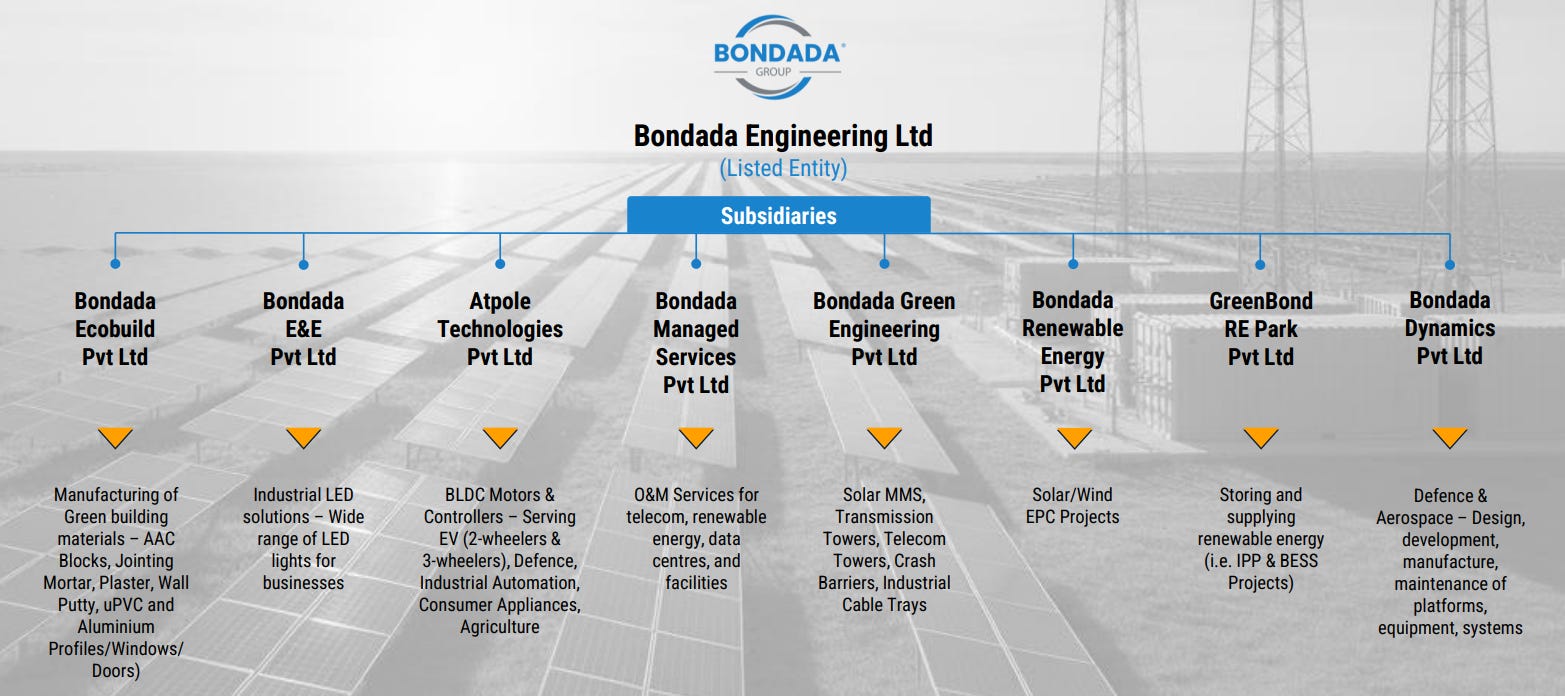
3.2 Business & Subsidiary Structure
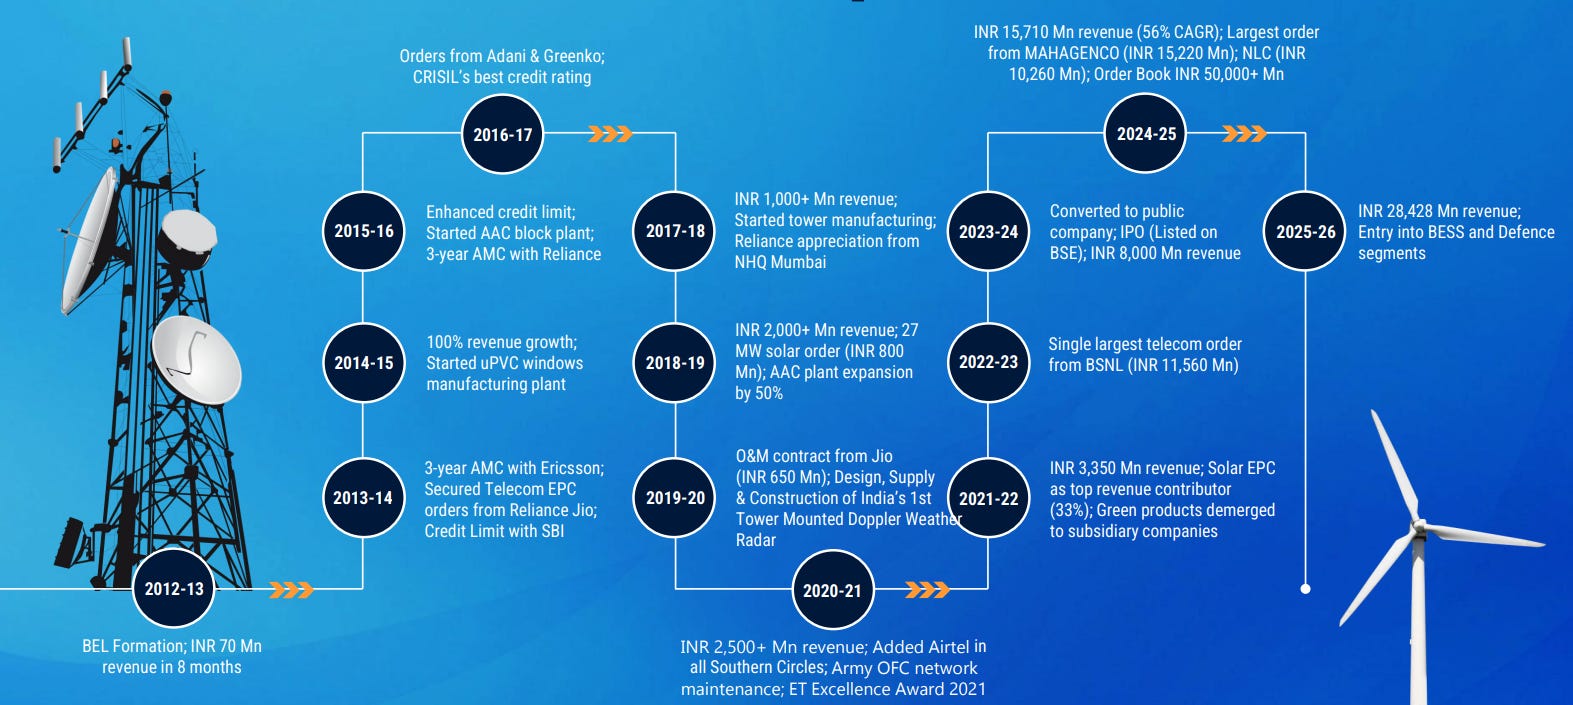
3.3 Company Journey
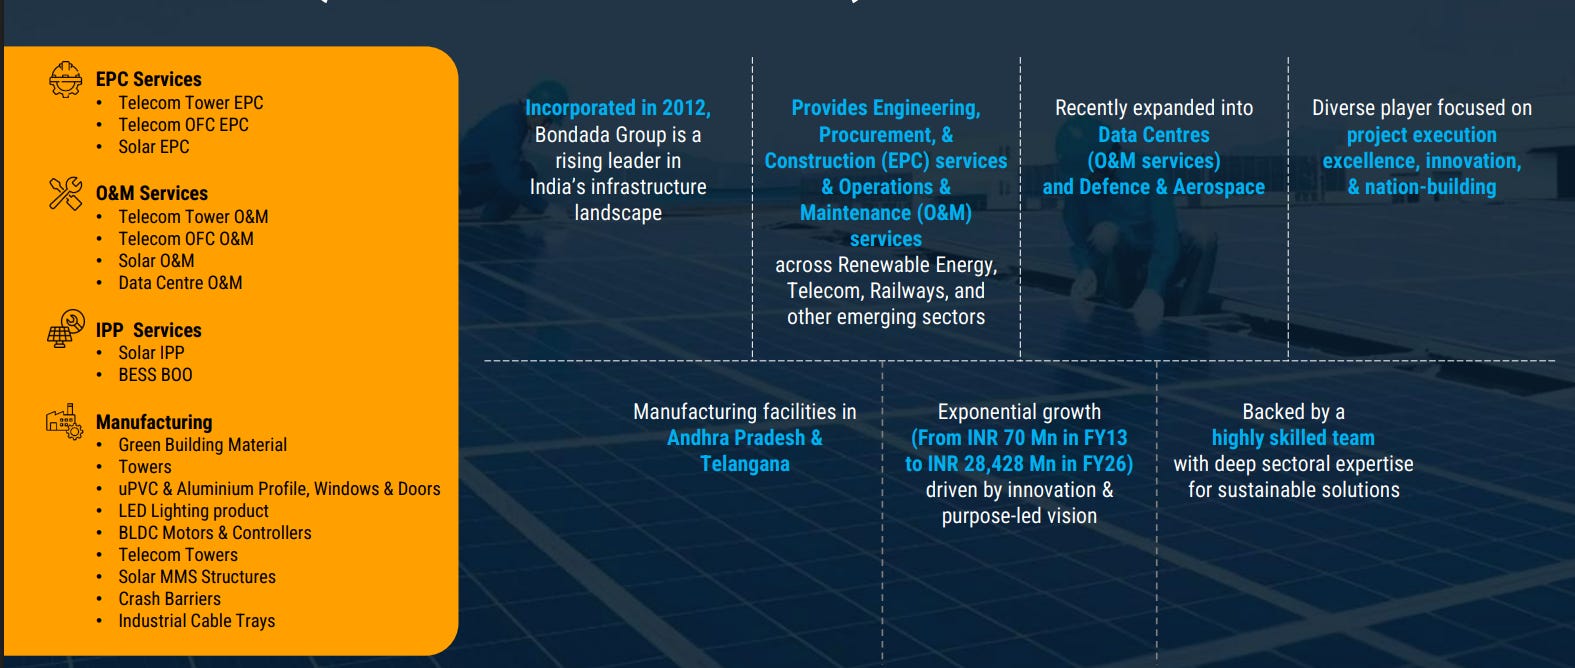
3.4 Business Segments
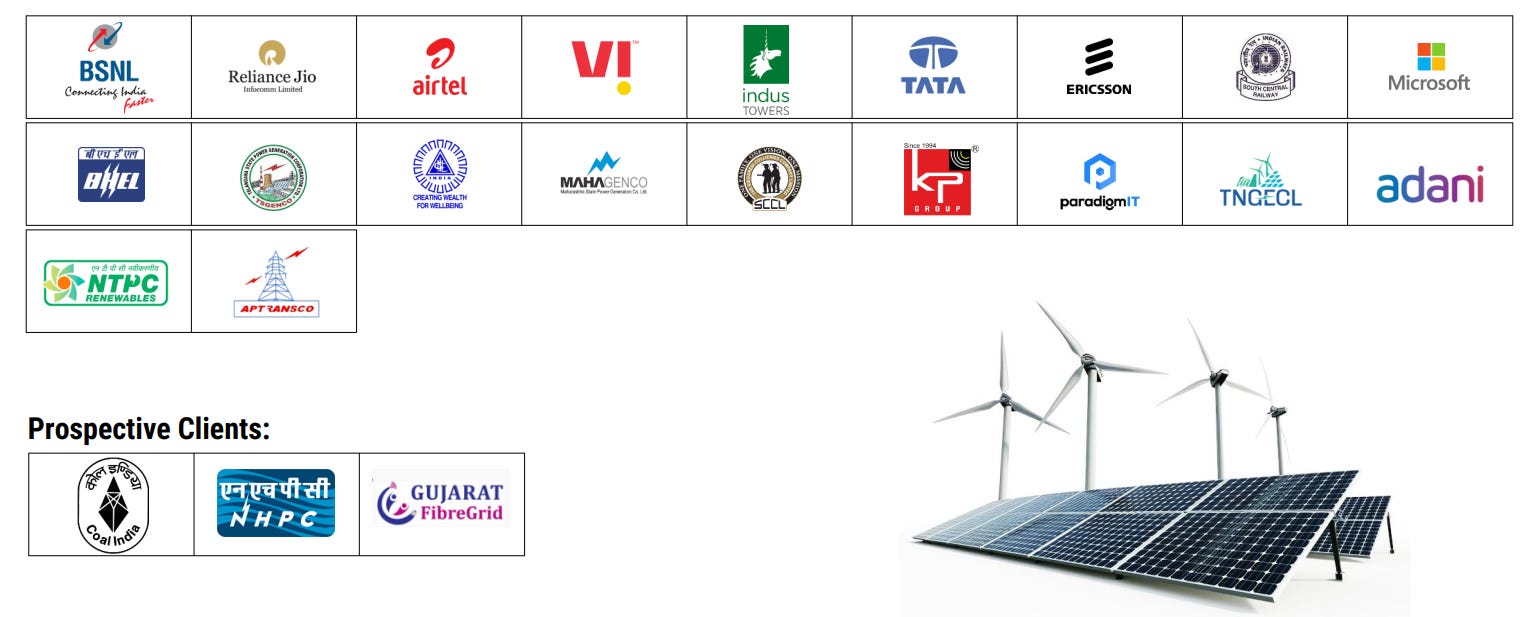
3.5 Clients
3.6 Renewable Energy Project Status
3.7 Recent Significant Order Wins
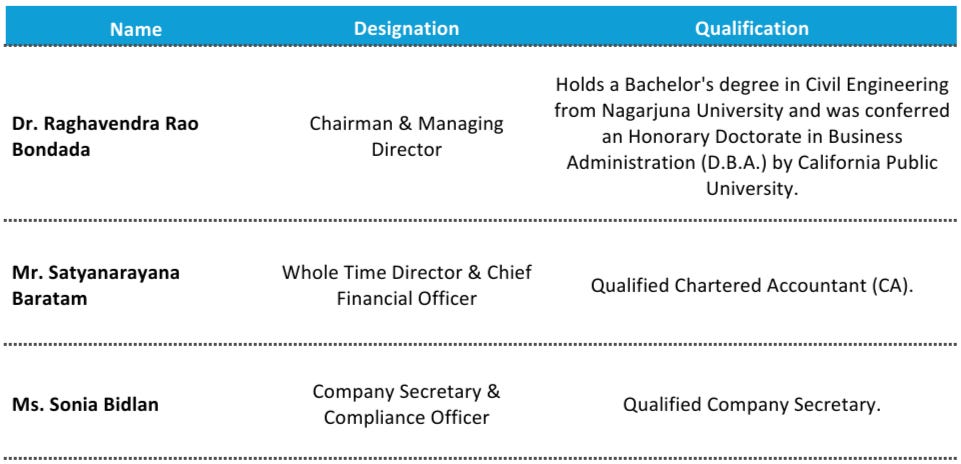
4. Management Overview:
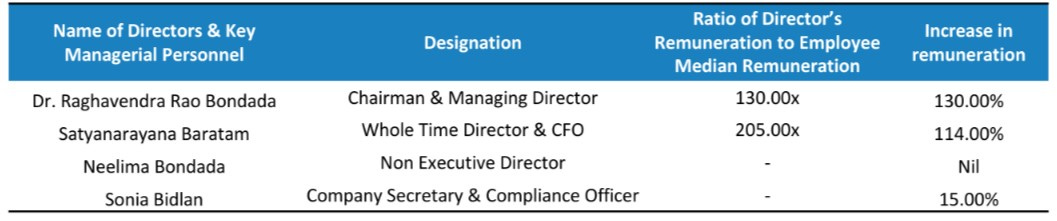
4. 1 KMP’s Remuneration:
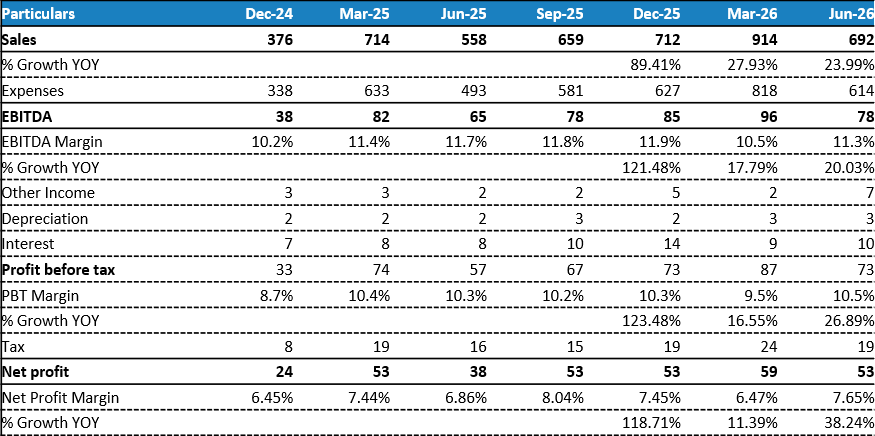
5.1 QUARTERLY ANALYSIS:
(Read detailed Quarterly Analysis in the Premium Version)
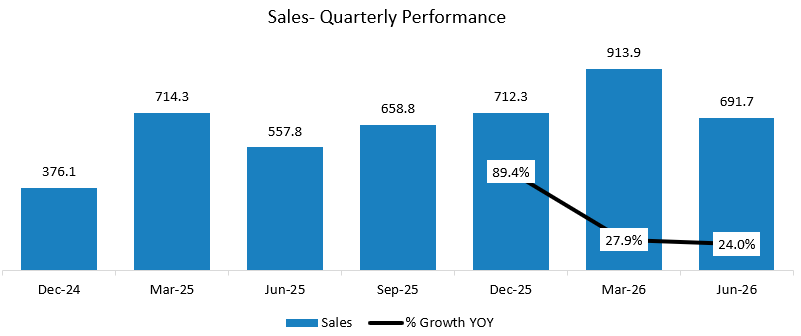
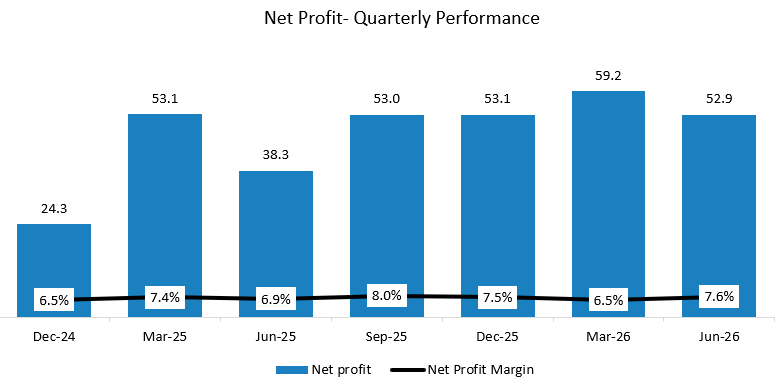
Growing at a CGR of 10.7% in last 7 Quarters.
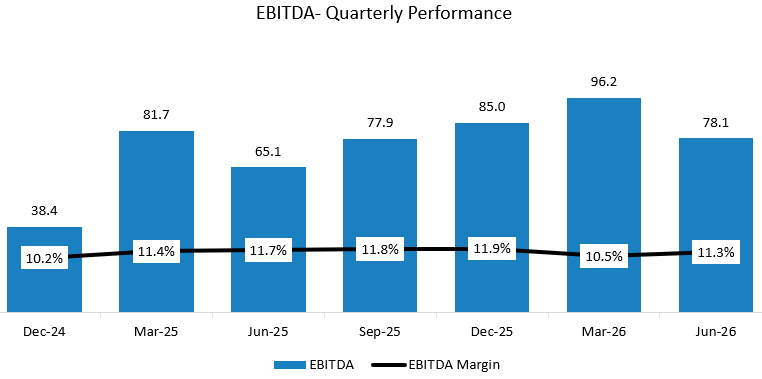
Growing at a CGR of 12.6% in last 7 Quarters.
Growing at a CGR of 13.9% in last 7 Quarters.
5.2 ANNUAL ANALYSIS:
(Read detailed Annual Analysis and Forecasts in the Premium Version)
5.2.1 Revenue:
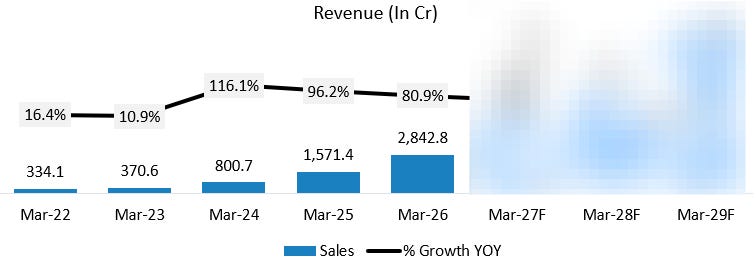
5Y CAGR: 70.8%
Revenue grew 96.2% in FY25 to ₹1,571 crore and 80.9% in FY26 to ₹2,843 crore, following 116.1% growth in FY24. This is a sustained multi-year ramp rather than a single-year event, with management citing a three-year CAGR of roughly 90% to 95% against a 14-year CAGR of about 53%.
The FY25 growth was driven predominantly by the renewable energy segment, where revenue moved from roughly ₹220 crore to ₹920 crore, a fourfold increase. Management attributed ₹650 crore of this incremental revenue to three PSU customers, Singareni Collieries and MAHAGENCO among them, on projects that had moved from order book to execution during the year.
The BSNL 4G saturation telecom project, secured in 2022, also continued contributing through this period as one of the company’s largest single contracts.
FY26 growth built on the same renewable energy base, which management stated constituted 78% to 80% of total revenue through the year. Execution scaled on large state and PSU allocations across Rajasthan (NLC, NTPC), Gujarat (Adani, NLC, KP Group), and Maharashtra (MAHAGENCO), alongside the first tranche of an Adani order in Khavda that management described as part of a 3 to 4 gigawatt relationship being discussed over the following three to four years.
The order book stood at ₹7,147 crore as of March 2026, with renewable energy alone contributing ₹4,536 crore, providing the base from which this execution was drawn.
5.2.2 Gross Profit:
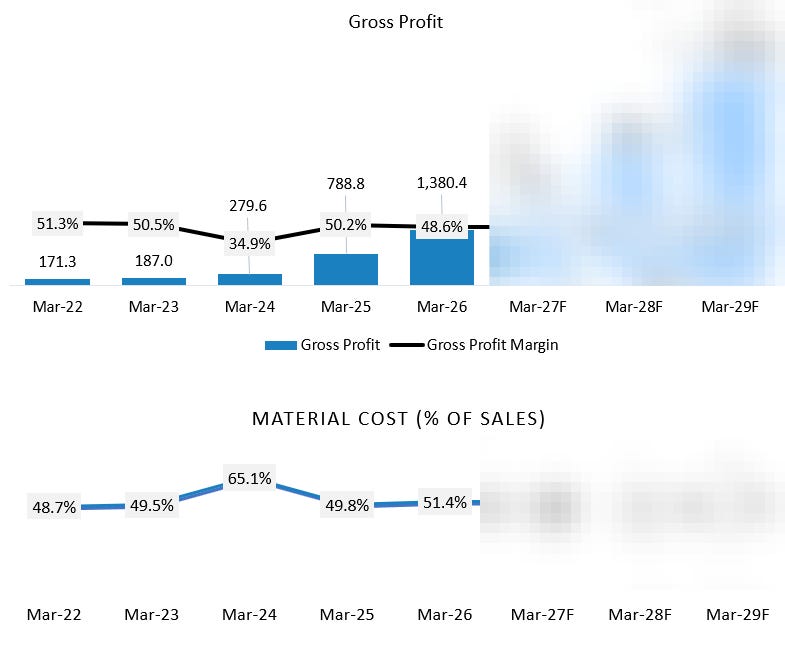
5Y CAGR: 68.5%
Gross profit margin declined to 48.6% in FY26 from 50.2% in FY25, a contraction of roughly 160 basis points.
Material cost as a percentage of sales rose to 51.4% in FY26 from 49.8% in FY25. This aligns with a point management made specifically about the fourth quarter, where they flagged steel and cable price increases, with cable costs up 17% to 18% quarter on quarter in Q4 FY26, and confirmed some low margin projects were billed within that quarter.
Whether this fourth quarter pressure was large enough on its own to move the full year material cost ratio by 160 basis points is not something the transcripts confirm.
5.2.3 EBITDA:
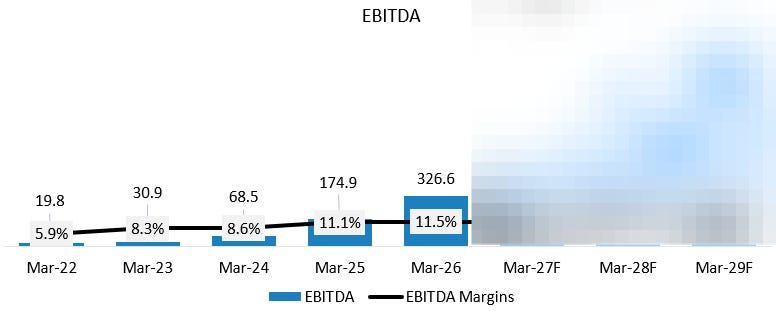
5Y CAGR: 101.4%
EBITDA margin moved from 5.9% in FY22 to 11.5% in FY26, with the steepest single-year jump occurring in FY25 (8.6% to 11.1%). Management’s explanation centers on operating leverage from larger project sizes. Contracts scaled from roughly 100-megawatt blocks to 300 and then 500-megawatt blocks over this period, and management stated this scale directly lifted the margin profile of PSU orders executed in FY25 by an estimated 3.5 to 4 percentage points.
A second contributor is pricing structure. Management described most large contracts as carrying fixed prices from the customer alongside fixed input costs locked in through advance payments to suppliers, which limits cost overrun risk once a contract is won and removes a source of margin volatility as volumes scale.
One item is worth flagging rather than explained: gross profit margin fell sharply to 34.9% in FY24 from roughly 50% in the surrounding years, coinciding with material cost rising to 65.1% of sales against a 48% to 51% range in every other year shown. Nothing in the Concall material available covers FY24 specifically, so this should be treated as an unexplained item rather than attributed to a cause, and it is worth keeping in mind given it sits directly beneath the revenue line in a year of otherwise strong growth.
5.2.4 Net Profit:
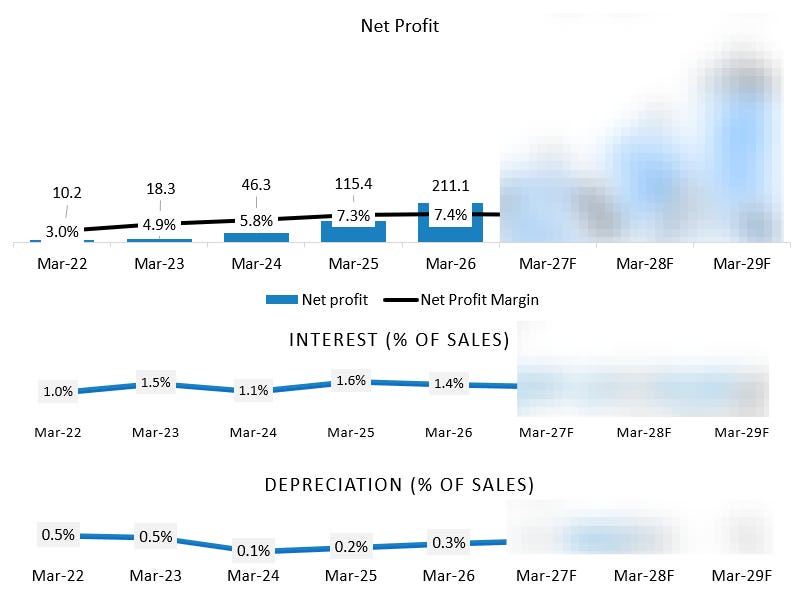
5Y CAGR: 113.5%
Interest expense rose from ₹3 crore in FY22 to ₹41 crore in FY26, a steeper trajectory than revenue growth in percentage terms through the middle years of the series. Management has consistently described the company as carrying little to no term debt, attributing balance sheet debt instead to working capital instruments, specifically bank guarantee utilization and a TReDS facility used to fund MSME supplier payments at a lower cost of finance.
Management has stated the company is net cash positive after netting off this working capital debt, which is a useful qualifier given the interest line does not read that way in isolation.
Depreciation also rose from ₹2 crore to ₹10 crore over the same period, consistent with the manufacturing capacity additions across the company’s subsidiary units. Despite both lines rising, PAT margin held broadly stable at ~7.4% in both FY25 and FY26.
5.2.5 Balance Sheet:
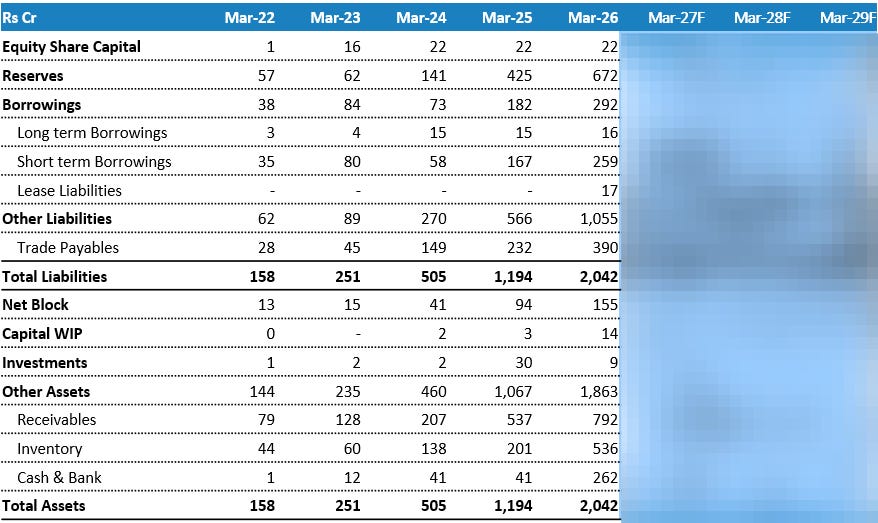
Borrowings
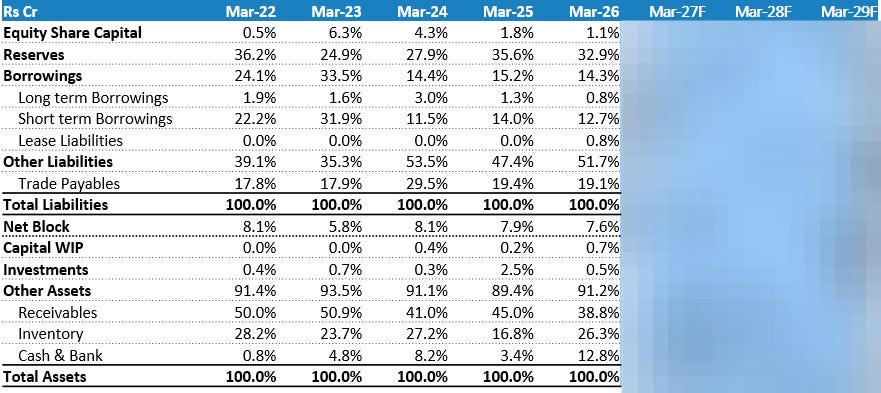
Borrowings rose from ₹182 crore to ₹292 crore in FY26, almost entirely from short term borrowings (₹167 crore to ₹259 crore). As a share of the balance sheet, though, borrowings have actually shrunk over five years, from 24% of total liabilities in FY22 to 14% in FY26.
Management explained the current liabilities rise (₹171 crore to ₹501 crore) through two working capital tools rather than debt: ₹150 crore of customer advances, and greater use of a TReDS facility to pay MSME vendors at a lower financing cost. They describe both as deliberate choices, not funding stress.
Long term debt remains minimal at ₹16 crore. Cash and bank balances also jumped to ₹262 crore from ₹41 crore, which management points to when calling the company net cash positive after netting off borrowings. What specifically drove this cash build, accruals, TReDS, or customer advances, isn’t separated out in the disclosures. Management has also flagged headroom to raise up to ₹1,500 crore in term debt for the IPP and BESS capex plans, undrawn as of FY26.
Other Assets (Note 17)
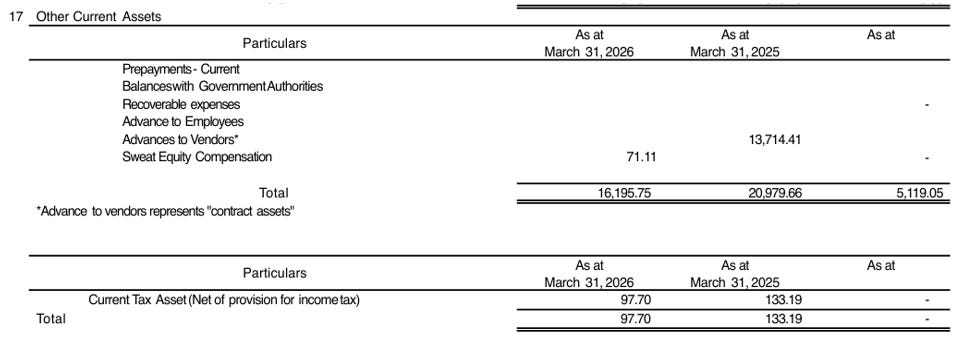
The Other Current Assets note for FY26 carries three items with figures: Advances to Vendors at nil, Sweat Equity Compensation at ₹0.71 crore, and a separate Current Tax Asset of ₹0.98 crore. Total for the note is ₹162 crore.
For FY25, the note carries Advances to Vendors at ₹137 crore and a Current Tax Asset of ₹1.33 crore. Total for the note is ₹210 crore.
Prepayments, Balances with Government Authorities, Recoverable Expenses and Advance to Employees carry no values in either year. The balance sheet’s broader Other Assets line totals ₹1,863 crore in FY26 and ₹1,067 crore in FY25. After removing receivables, inventory and cash, the residual against the note total is roughly ₹273 crore in FY26 and ₹289 crore in FY25.
Other Liabilities (Note 29)
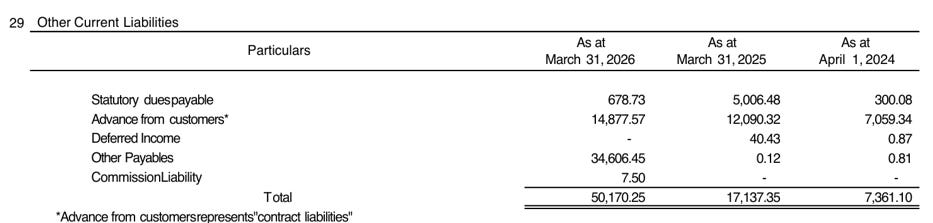
The Other Current Liabilities note for FY26 shows Statutory Dues Payable at ₹6.79 crore, Advance from Customers at ₹148.78 crore, Other Payables at ₹346.06 crore, and Commission Liability at ₹0.08 crore. Deferred Income is nil. Total is ₹502 crore.
For FY25, the note shows Statutory Dues Payable at ₹50.06 crore, Advance from Customers at ₹120.90 crore, Deferred Income at ₹0.40 crore, and Other Payables at near nil. Total is ₹171 crore.
The balance sheet’s broader Other Liabilities line totals ₹1,055 crore in FY26 and ₹566 crore in FY25. After removing Trade Payables, the residual against the note total is roughly ₹665 crore in FY26 and ₹395 crore in FY25.
5.2.6 Common-Size Balance Sheet:
5.2.7 Cash Flow Analysis:
CFO dip in FY25
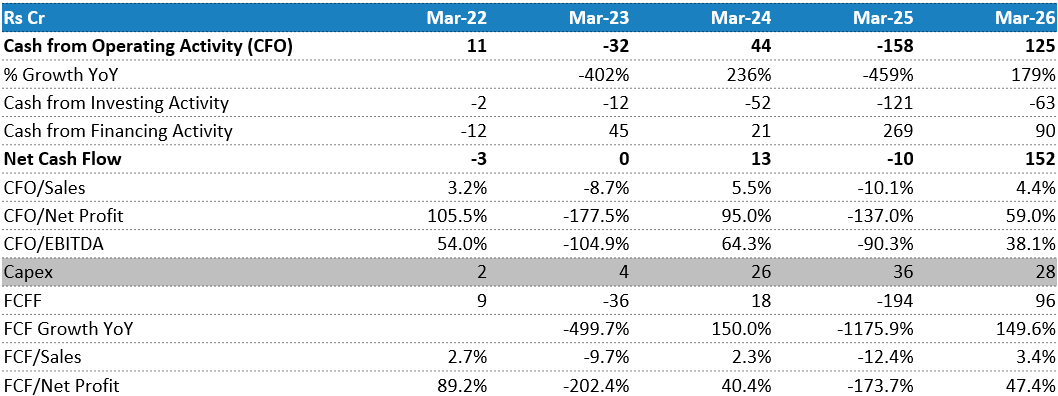
CFO fell to negative ₹158 crore in FY25, from positive ₹44 crore in FY24, despite profit from operations rising sharply to ₹179 crore. The entire swing is a working capital story, with working capital changes at negative ₹304 crore for the year.
Receivables absorbed ₹331 crore of cash, the single largest drag, consistent with revenue nearly doubling in FY25. Inventory absorbed a further ₹63 crore, and Loans Advances a further ₹115 crore, only partly offset by payables contributing ₹82 crore and other working capital items contributing ₹123 crore.
₹120 crore was locked up as advances paid to module, inverter and other long lead item suppliers, taken to fix input prices and secure delivery timelines on fixed price customer contracts. This, combined with high volume growth pulling receivables up sharply, is what pushed operating cash flow negative for the year.
Consistent negative CFI
CFI has been negative in every year shown, ranging from negative ₹1 crore in FY20 to negative ₹121 crore in FY25, before easing to negative ₹63 crore in FY26. Fixed assets purchased is the dominant line throughout, rising from low single digits in the earlier years to ₹36.26 crore in FY25 and ₹28.17 crore in FY26, consistent with capacity additions across the company’s manufacturing units for towers, MMS structures and green construction products.
FY25 also carries ₹35.22 crore of investments purchased and a further ₹55.02 crore under other investing items, both large relative to prior years and not broken out further in the data shown. The negative sign across all seven years reflects continuous capacity build rather than a one-off capex cycle, but the scale step-up from FY24 onwards lines up with the broader revenue and order book expansion over the same period.
CFF jump in FY25
CFF rose to ₹269 crore in FY25 from ₹21 crore in FY24, the largest financing inflow in the series. This was driven by two roughly equal sources: ₹167 crore of proceeds from shares and ₹109 crore of proceeds from borrowings.
The equity component lines up with the company’s listing-related capital raises around this period. The borrowings component sits against a backdrop where the company carries limited long-term debt and instead leans on working capital instruments such as bank guarantee limits and vendor financing facilities, so this inflow likely funded the same working capital build reflected in the negative CFO for the year.
By FY26, the financing mix shifted, with proceeds from shares falling to ₹41 crore while proceeds from borrowings rose to ₹94 crore, and interest paid on the financing side more than doubling to ₹41 crore, consistent with the higher short term borrowings balance on the balance sheet that year.
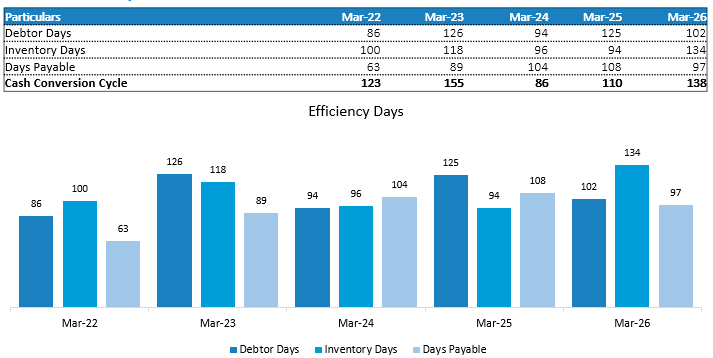
5.2.8 Cash Conversion Cycle:
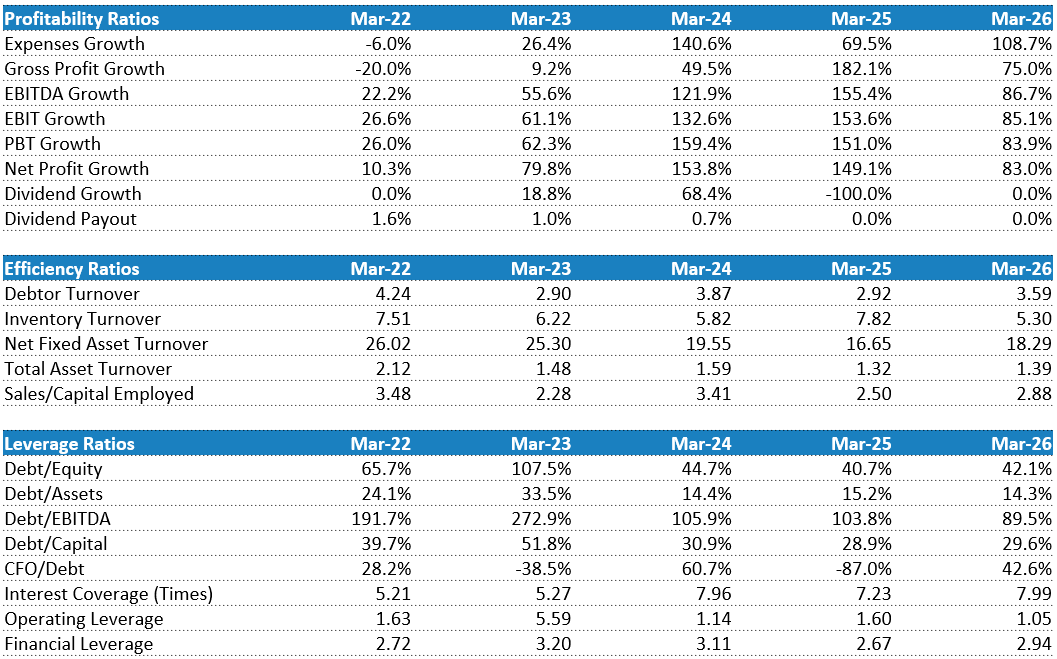
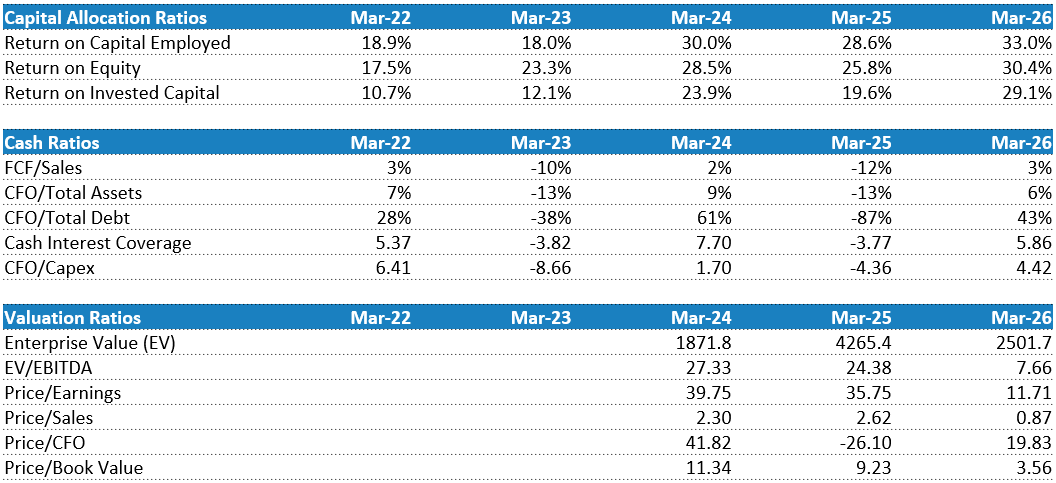
6. Key Ratios:
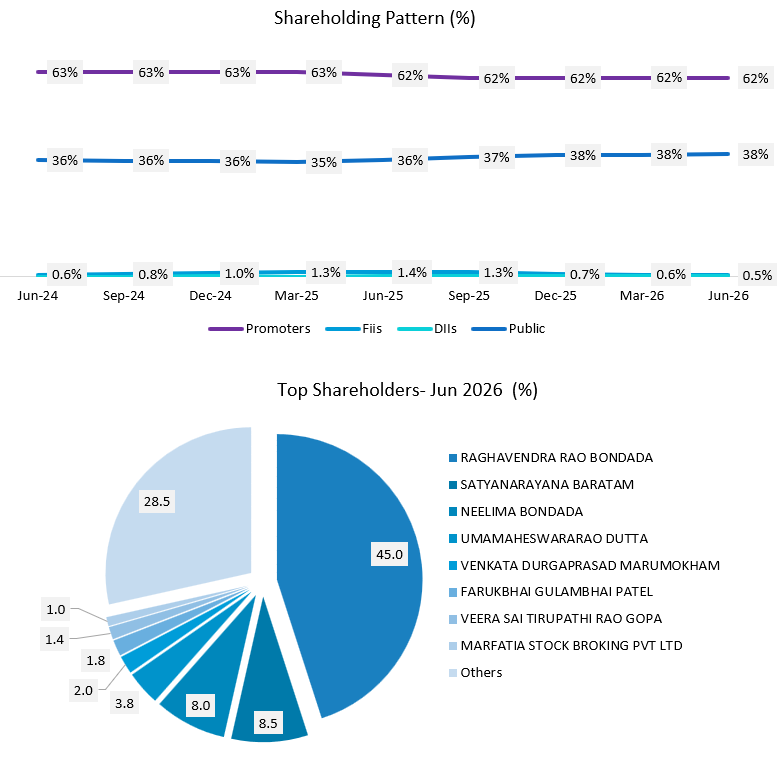
7. Shareholding Pattern:
You know, we have 3 Tiers to Our Offerings:
I am just starting out! – ₹999/month (Monthly Plan)
I know what I am doing! – ₹2,699/quarter (~₹899/month, Best Value)
I want to create wealth – ₹11,999/year (~₹999/month, Plus You get all access to all reports prepared till date)
You can start with any and can upgrade in between with no additional charges.
To know more, you can reach out to us at:
Email: team@equityedgereaearch.in
Ph No: +91 88590 79630
Please Continue….
8. Con-Call Analysis
1. Performance Overview:
Robust Order Book Status: Sitting on a massive order book of Rs. 7,147 crores as of March 31, 2026, which is scheduled for execution over the next 18 to 20 months.
Segmental Contribution: The order book is led by Solar EPC at 65% (Rs. 4,536 crores), followed by BESS (Rs. 1,463 crores), with the remainder distributed across Telecom, Indian Railways (Kavach infrastructure), and emerging Defense and Aerospace products.
2. Strategic Initiatives & Growth Levers
Bondada is actively executing a transition plan to progress from a pure-play EPC contractor into an intellectual property-led product and IPP player.
Migration to Main Board: Plans are underway to migrate the company’s listing from the SME platform to the main boards of the BSE and NSE in FY27. This transition is aimed at expanding the company’s institutional investor base and improving market visibility.
BESS Expansion and Discerning Bid Strategy:
The company has accumulated an order book of 850 MWh of Battery Energy Storage Systems (BESS) across two annuity-based contracts (400 MWh in Tamil Nadu and 450 MWh in Andhra Pradesh) with a 12-year revenue lifespan.
Cautious Bidding: Management highlighted that they are intentionally staying away from unviable BESS contracts (such as recent NTPC and Coal India tenders) where reverse auctions have driven tariffs below commercially viable thresholds.
Hyperscaler Data Centers (Bryanston MOU):
Partnered under an MOU with UK/Dubai-based Bryanston to secure contracts with global hyperscaler data center operators. Bondada’s role involves pooling land, setting up shell infrastructure, power lines, and fiber connectivity.
Data center operations are expected to contribute 7% to 8% of total revenue in FY27, targeting an EBITDA margin of 14% to 15%.
High-Margin Defense & Aerospace Entry:
Seeking to shift the company’s internal mix from 90% EPC / 10% Products to a higher-margin 70% EPC / 30% Products ratio.
Secured a prototype component supply order for missiles under an NDA with Bharat Electronics Limited (BEL). Successful trials are expected to unlock multi-year mass production contracts.
Inorganic Strategy: The company is in advanced negotiations to acquire/merge with three defense-oriented firms to onboard high-value intellectual capital and technical capabilities.
Indian Railways Kavach Program:
Actively deploying passive communication infrastructure (towers and optical fiber layout) alongside tracks to support the Indian Railways’ Kavach train-collision avoidance system. The company won its first major contract under South Central Railway and is bidding for additional zones.
3. Capacity, Capex, & Future Targets
Integrated Manufacturing Facility near Hyderabad:
The company has identified and acquired 27 acres of land near Hyderabad to consolidate all manufacturing units under one roof.
This plant will fabricate Solar Module Mounting Structures (MMS), telecom/transmission towers, and assemble Vanadium-based battery energy storage components.
Capex & Timeline: The total capital outlay is estimated at Rs. 120–130 crores (including land costs), with construction set to begin in Q2 FY27. The plant will take approximately one year to commission and can support Rs. 1,500 to Rs. 1,800 crores of annual revenue once fully operational.
Andhra Pradesh (AP) 2 GW IPP Project:
The company is initiating land pooling for a massive 2 GW Independent Power Producer (IPP) solar project in Andhra Pradesh, valued at Rs. 9,000 crores. This project is currently structured under an SPV and is kept separate from the core Rs. 7,147 crores order book.
Phased Equity Funding: The project will be built in phases over the next 3 to 4 years. The first 250 MW phase will require a Rs. 250 crore equity infusion, which management plans to fund comfortably via various financing pathways (with no immediate dilution threat).
Vision 2030: Upgraded its long-term capacity target to 25 GW of renewable energy capacity by 2030 (split into 16 GW Solar and 9 GW BESS). This capacity expansion aligns with their long-term target of reaching $1 billion in revenue by 2030.
4. Margin Analysis & Cost Dynamics
Q4 Margin Compression Factors: Management addressed a sequential compression in Q4 margins, attributing it to two main temporary variables:
The execution and billing of certain low-margin legacy project milestones during the fourth quarter.
An upward movement in raw material inputs during H2 FY26, specifically a 17% to 18% surge in cable and steel prices driven by seasonal demands and geopolitical tensions.
Annual Resiliency: Despite the Q4 dip, overall annual profitability improved by 30 basis points, with net profit margins rising from 7.2% in FY25 to 7.5% in FY26.
Price Volatility Mitigation: The company has managed cost spikes by staggering its material deliveries during abnormally high price periods. Additionally, several major contracts have built-in pass-through pricing agreements.
Future Margin Outlook: Management comfortably guided to a long-term target of 11% to 12% EBITDA margin and 7% PAT margin for FY27.
5. Working Capital and Liquidity Management
Working Capital Optimization: The company successfully turned its cash flow positive in FY26, reporting Rs. 125 crores of positive operating cash flow.
Receivables Control: Receivables stood at Rs. 790 crores with a collection period (aging cycle) of 87 days, significantly healthier than the typical industry average of 110 to 120 days. Outstanding collections from major public sector undertakings (NLC, NTPC, MAHAGENCO) remain stable at 85 to 90 days.
April Collections: Collected Rs. 130 crores of the outstanding receivables within the first 25 days of April 2026.
Near Net-Debt-Free Status: Netting off balance sheet debt, the company maintains a net cash surplus of approximately Rs. 100 crores, leaving it financially sound.
Explanation on Rising Current Liabilities: Current liabilities increased from Rs. 171 crores to Rs. 501 crores. Management clarified that this Rs. 330 crore increase was driven by. Rs. 150 crores received as milestone-based advances from customers. The implementation of the TReDS (Trade Receivables Discounting System) facility to fund MSME supplier payments at lower finance costs, significantly optimizing internal cash resources.
6. Key Q&A Insights
FY27 Revenue Guidance: Following execution of the massive current order book, management expects 60% to 70% top-line and bottom-line growth for the coming fiscal year.
BESS Project IRRs: Internal Rate of Return (IRR) for the annuity-based TN and AP BESS projects is projected at 13% to 14%. The Tamil Nadu project has achieved financial closure, with Canara Bank serving as the primary lead lender.
Long-Term Revenue Mix (FY28-29): Once the IPPs and product lines stabilize, the revenue mix is projected to normalize at 50%-60% EPC, 20%-25% IPP, and 15%-20% Products.
Data Center Execution Model: For Bryanston data centers, Bondada does not plan to lock up capital in long-term infrastructure assets. Instead, it operates on a short-term construction-to-handover cycle (6 to 8 months), recovering capital promptly from hyperscalers.
9. SWOT ANALYSIS:
Strengths
Strong Solar EPC Execution: 14+ years of experience, 2,500+ workforce, ~1.3 GWp commissioned capacity, and a large ~7.8 GW active solar portfolio across major renewable-energy states.
Reliable Telecom Infrastructure: 11,000+ towers built with proven BSNL 4G execution and ~99.89% network uptime for Reliance Jio, supported by a 1,935-member O&M team.
Early BESS Leadership: 850 MWh of BESS projects under BOO models provides an early position in India’s rapidly expanding grid-scale storage market.
Pan-India Client & Project Reach: Presence across 23+ states/UTs and strong relationships with major utilities, PSUs, and private players provide diversified execution opportunities.
Weaknesses
High Order Book Concentration: Over 70% of current utility execution is concentrated in three major projects, increasing exposure to project-specific delays.
Working Capital Intensity: Projects require 60–75 days of inventory/WIP while collections typically take 85–90 days, increasing funding requirements.
Geographic Concentration: More than 60% of solar and BESS activity is concentrated in four states, exposing execution to localized disruptions.
EPC-Heavy Revenue Mix: Around 90% of the business remains service-led EPC, while higher-value proprietary products contribute only ~10%.
Opportunities
Large-Scale Solar IPP Expansion: Planned development of a 2 GW solar IPP in Andhra Pradesh can create long-term recurring power-generation revenues.
Long-Duration Energy Storage: Entry into VRFB and other LDES technologies can diversify the BESS portfolio and address long-duration grid-storage requirements.
Defence & Aerospace Diversification: Expansion into missile components, RF/microwave systems, and composites can increase the contribution of higher-value products.
Data Centre Infrastructure: Planned connection-ready data-centre developments in Hyderabad and Visakhapatnam can create a new growth vertical alongside the core EPC business.
Threats
Aggressive Tender Competition: Irrational bidding in solar and BESS reverse auctions can compress project economics and force the company to reject low-return opportunities.
Grid & Evacuation Constraints: Transmission bottlenecks and delays in grid infrastructure can postpone synchronization and commercial operation of renewable projects.
Rapid Technology Changes: Fast evolution in battery chemistries, power electronics, and BLDC technologies could make existing manufacturing capabilities obsolete.
Land & RoW Delays: Land acquisition, statutory approvals, and Right-of-Way clearances can delay railway, solar, and other linear infrastructure projects.
10. Competitors:
10.1 Pace Digitek Ltd.

Market Cap: ₹ 3,927 Cr.
Pace Digitek Ltd., headquartered in Bengaluru, Karnataka, operates in the Telecom, Energy & ICT Infrastructure Industry. The company provides telecom power equipment, lithium-ion battery systems, telecom infrastructure, solar EPC, battery energy storage solutions, and ICT infrastructure services.
Business Model:
Pace Digitek follows a manufacturing + EPC + operations & maintenance model across telecom and energy infrastructure.
Its key offerings include telecom power systems, lithium-ion battery racks, telecom towers & fibre networks, solar EPC, and battery energy storage systems (BESS).
Revenue is generated through:
Sale of telecom power and battery products.
Telecom infrastructure and EPC projects.
Solar and energy storage projects.
Operations, maintenance, installation and equipment-upgradation services.
What Sets Them Apart:
Diversified Infrastructure Exposure: Presence across telecom, energy, solar and ICT.
Battery & Energy Storage Focus: Increasing exposure to lithium-ion batteries and BESS.
Integrated Capabilities: Combines manufacturing, EPC, installation and O&M services.
Strong Telecom Expertise: Around 18 years of experience with pan-India operations.
10.2 GK Energy Ltd.
Market Cap: ₹ 2,776 Cr.
GK Energy Ltd., headquartered in Pune, Maharashtra, operates in the Renewable Energy and Solar EPC Industry. The company is primarily focused on solar-powered agricultural water pumping systems, particularly under the PM-KUSUM Scheme, and also provides rooftop solar and other decentralized renewable energy solutions.
Business Model:
GK Energy follows an asset-light EPC model, providing end-to-end solutions including design, procurement, installation, testing and commissioning.
Its key offerings include:
Solar agricultural water pumps
Solar rooftop systems
Solar PV modules and related equipment
Jal Jeevan Mission-related EPC solutions
Revenue is primarily generated from EPC contracts and supply of solar systems, with additional revenue from trading solar cells and modules.
What Sets Them Apart:
PM-KUSUM Leadership: One of India’s largest pure-play EPC providers for solar agricultural pumps under PM-KUSUM Component B.
Asset-Light Model: Sources key components through an OEM/ODM ecosystem while focusing on project execution and customer delivery.
Strong Execution Track Record: Installed more than 61,000 solar systems during FY26 and deployed 276 MW of renewable capacity.
Diversification: Expanding beyond solar pumps into rooftop solar and other decentralized renewable energy solutions.