Here at EquityEdge Research, we make Small-Cap Investing easy for you by Backing you up with Robust & Full-Fledged Research.
We Have Launched Our Website. Please check
Please Fill the form Below if you are interested in our Services and would like a Free Sample of our Equity Research Report covering a Small/Micro-cap Company.
Read our Previous Report here:
Tribhovandas Bhimji Zaveri Ltd

Here at EquityEdge Research, we make Small-Cap Investing easy for you by Backing you up with Robust & Full-Fledged Research.
Table of Contents:
Key Highlights.
Company Price Chart Analysis.
About the Company.
Management Analysis.
Financial Analysis
Ratio Analysis.
Shareholding Analysis.
Concall Analysis.
SWOT Analysis.
Competitors.
Premium (Includes Free):
Global Jewellery Industry.
Indian Jewellery Industry.
Financial Analysis- Quarterly.
Competitive Analysis- Bio & Financials.
Daily Share price trend TTM- Peer comparison.
Segment Wise Performance.
1. Key Highlights:
FY26
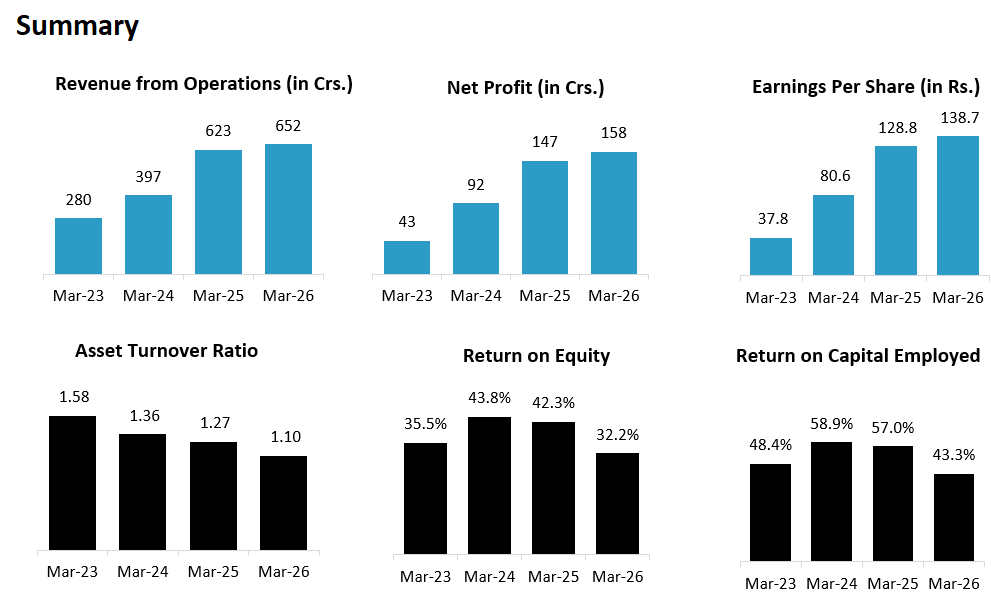
REVENUE: ₹ 652 Cr. (+4.66% YoY)
EBITDA: ₹ 190 Cr. (+2.7% YoY)
EBITDA MARGIN: 29% (-100 bps YoY)
PAT: ₹ 158 Cr. (+7.48% YoY)
Q4FY26
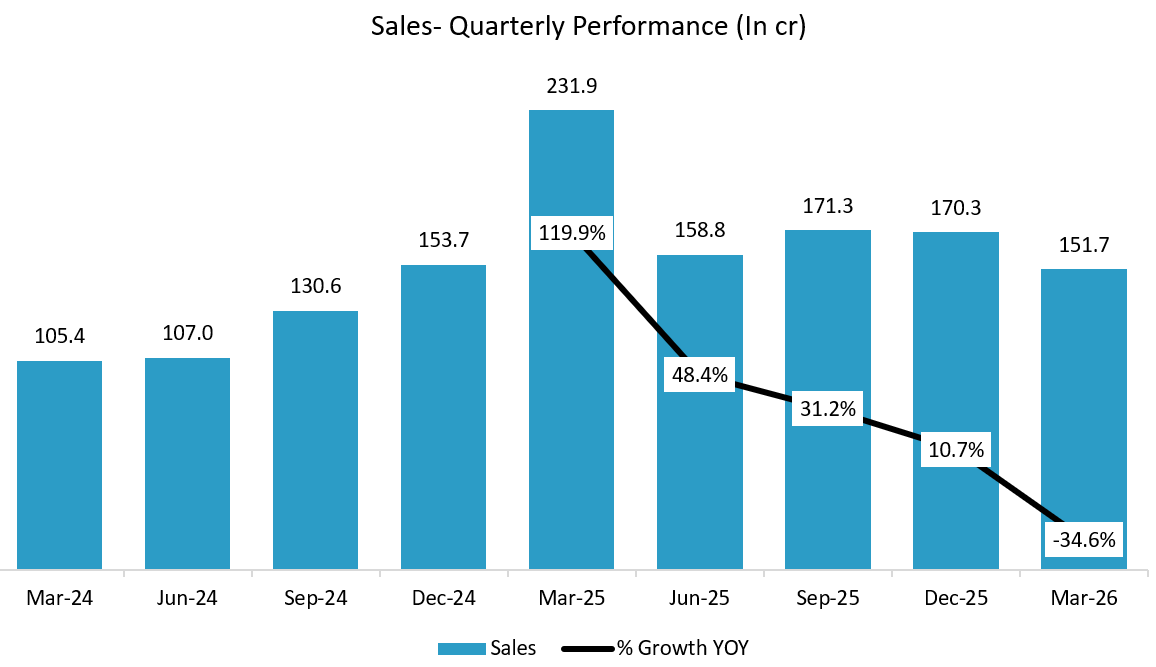
REVENUE: ₹ 152 Cr. (-10.59% QoQ, -34.48% YoY)
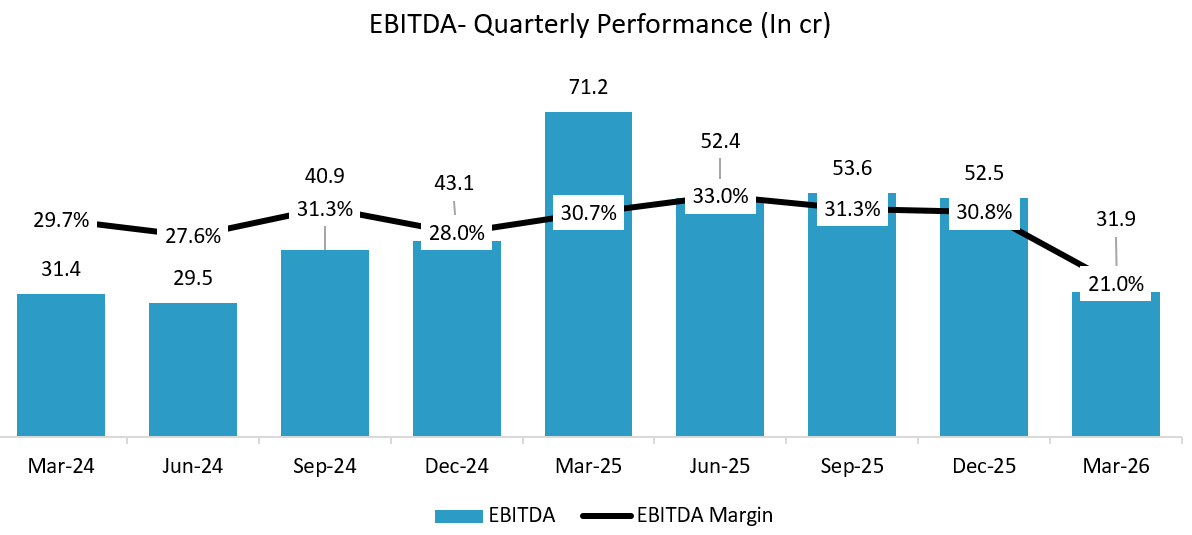
EBITDA: ₹ 32 Cr. (-38.46% QoQ, -54.93% YoY)
EBITDA MARGIN: 21% (+ bps QoQ, + in YoY)
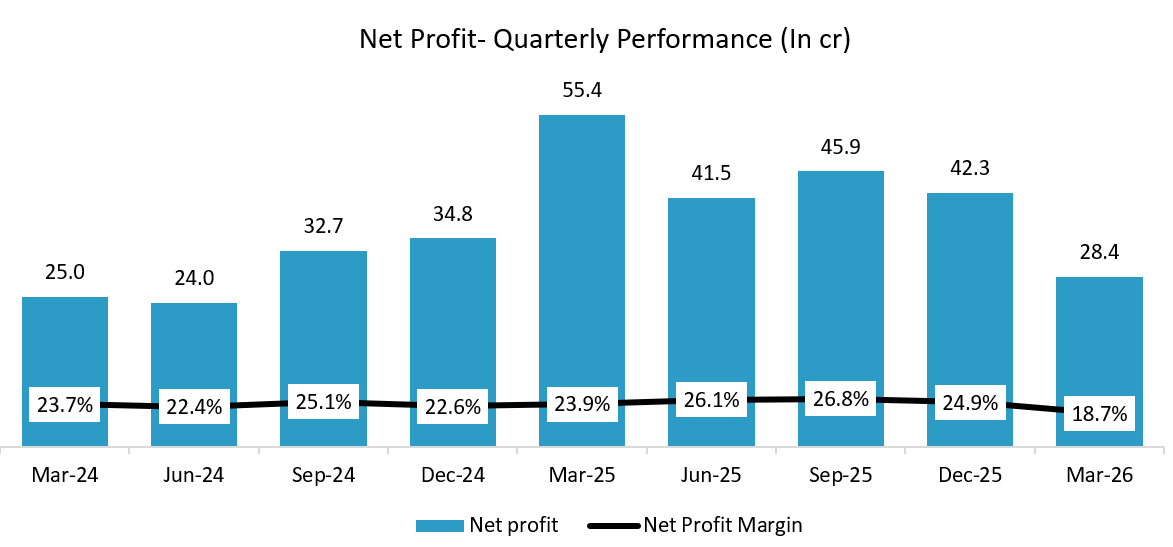
PAT: ₹ 28 Cr. (-33.33% QoQ, -49.09% YoY)
OTHER HIGHLIGHTS:
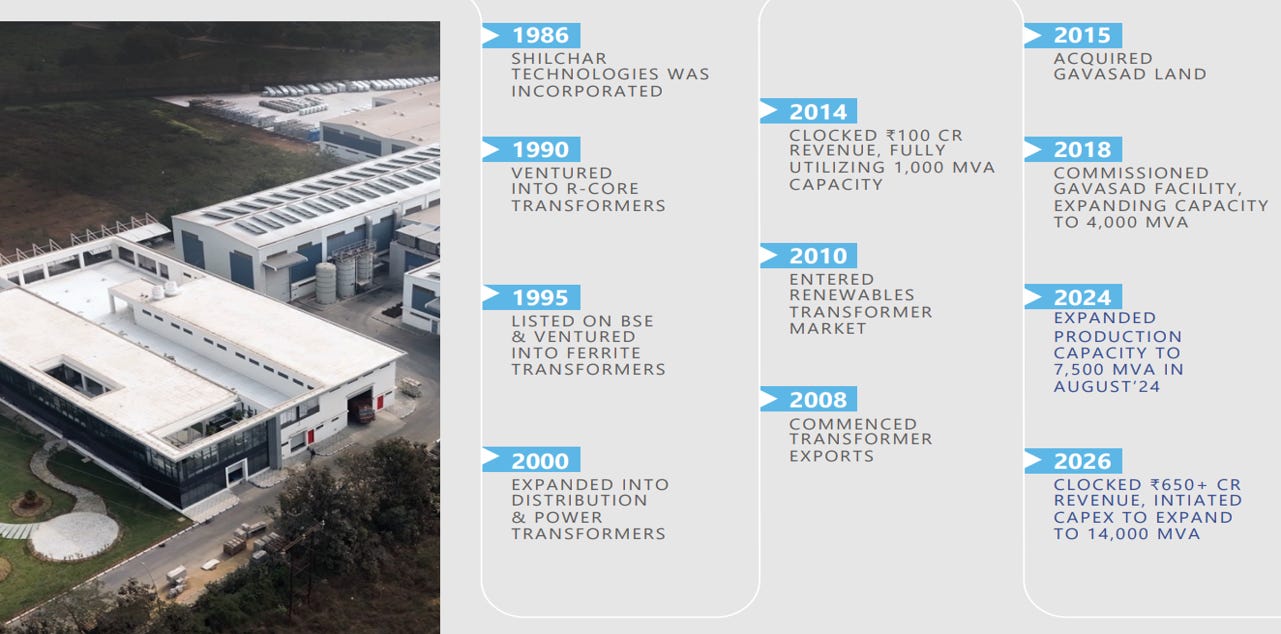
Current Installed Capacity: 7,500 MVA (fully operational since August 2024).
Expansion Plan: New 6,500 MVA facility at Gavasad (Expansion #3) is on track for commissioning in April 2027, taking total capacity to 14,000 MVA.
Land Bank: 17-acre site with sufficient land for potential ~2X further capacity increase (brownfield expansion).
Order Pipeline: ~₹800 crore for FY27.
Demand Outlook: Strong domestic demand (renewables commissioning of ~55 GW in FY26) and robust export demand.
2026: ₹650+ crore revenue; initiated CAPEX to reach 14,000 MVA.
2. Company Price Chart Analysis:
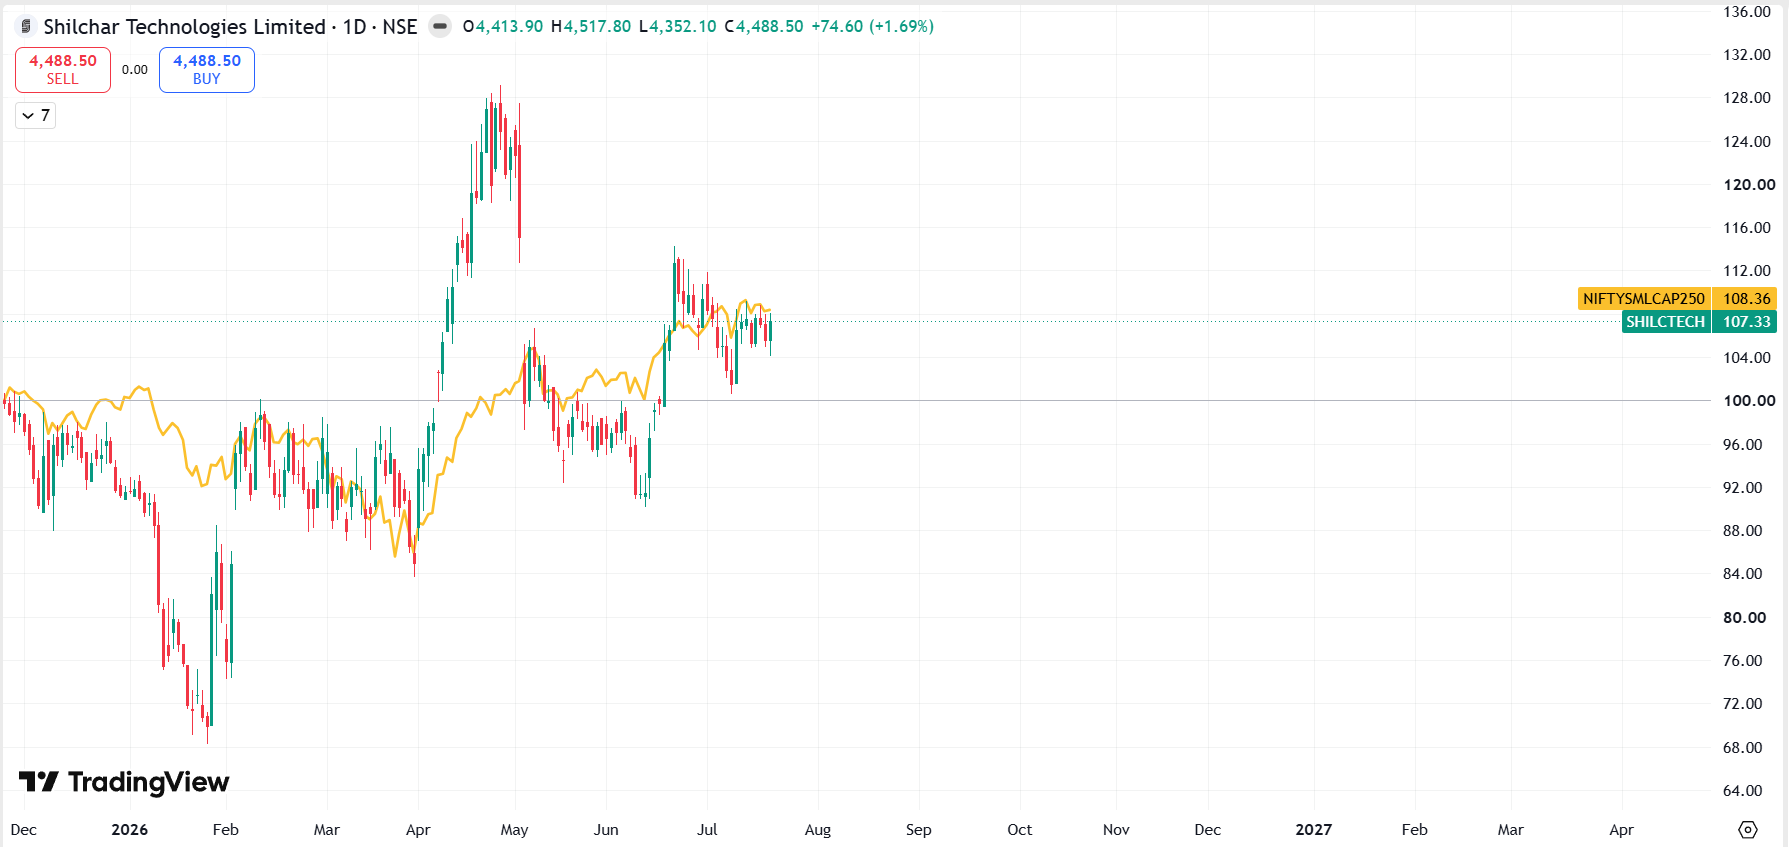
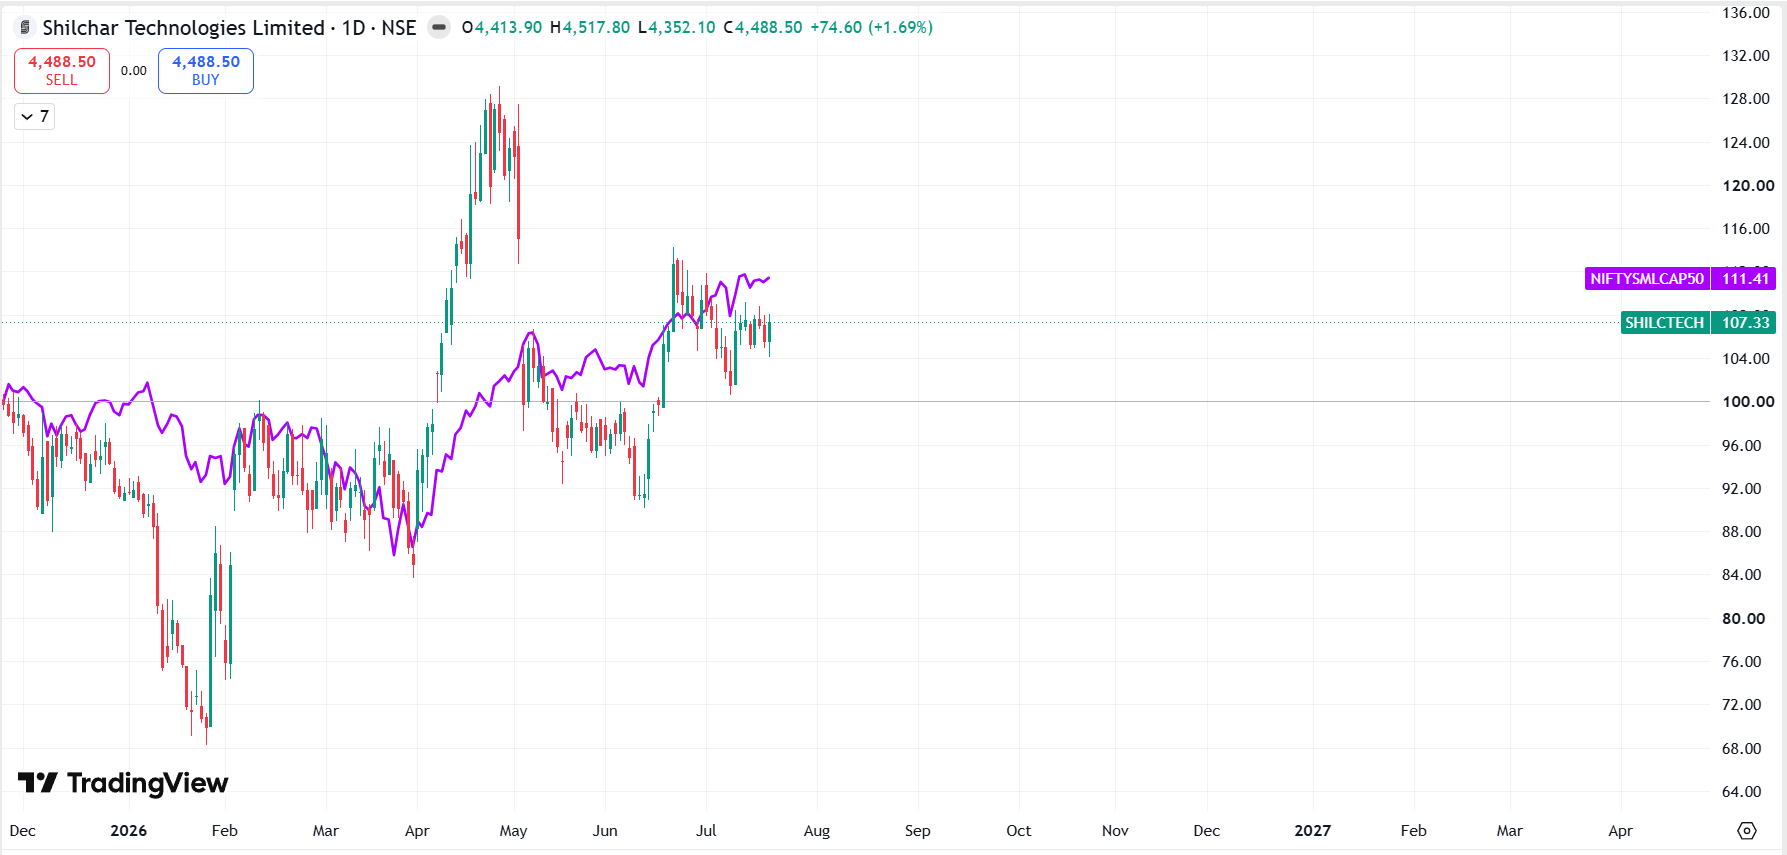
*Comparison charts are Indexed*
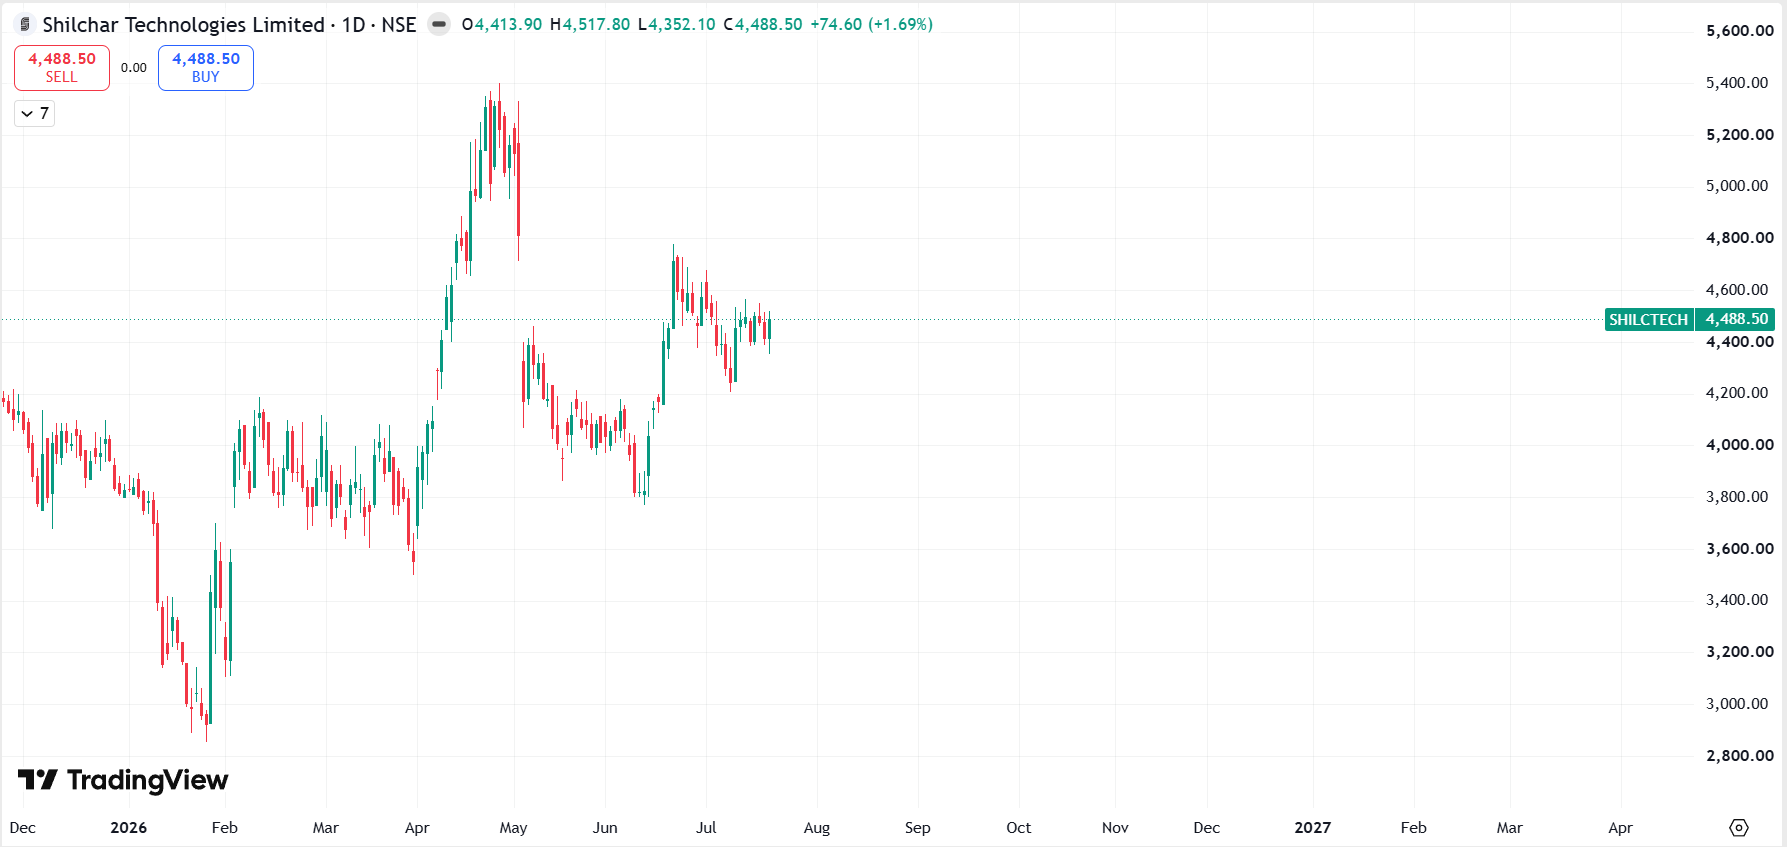
2.1 Shilchar Technologies Ltd. Performance:
2.2 Shilchar Technologies Ltd. Vs. NFTYSMLCAP250:
2.3 Shilchar Technologies Ltd. Vs. NFTYSMLCAP50:
3. About Company:

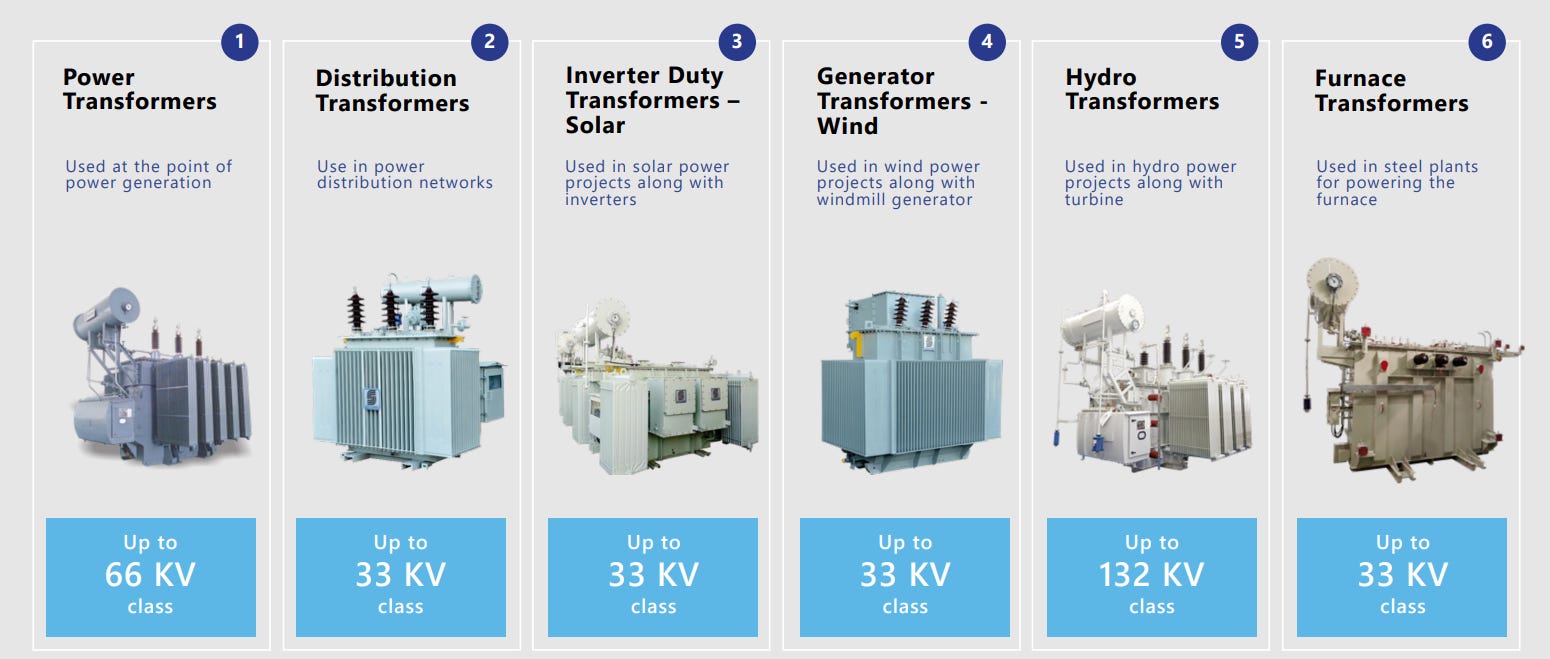
Shilchar Technologies Ltd. is a leading Indian manufacturer of power, distribution, and electronics transformers. The company serves a wide range of industries including renewable energy, power utilities, EPC contractors, steel, cement, oil & gas, and industrial customers. It has established a strong presence in both domestic and export markets, with exports contributing a significant share of its revenue. Over the years, Shilchar has evolved from manufacturing electronic transformers to becoming a specialized player in power infrastructure and renewable energy transformers.
3.1 BUSNISS SEGMENTS:
1. Power & Distribution Transformers:
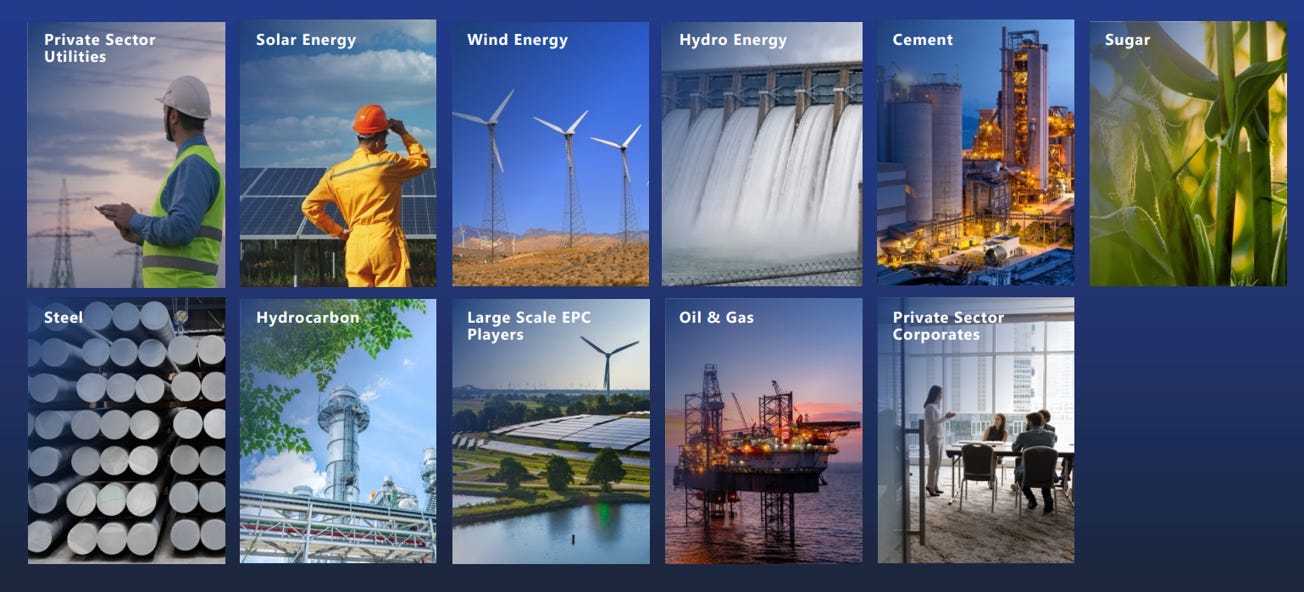
This is the largest and fastest-growing business vertical of the company. It manufactures power transformers, distribution transformers, inverter-duty transformers, generator transformers, furnace transformers, converter-duty transformers, and specialty transformers used in power transmission, renewable energy projects, utilities, and industrial applications. The products are supplied to solar and wind projects, power utilities, EPC companies, and industries.
2. Electronics & Telecom Transformers:
This vertical manufactures R-core, ferrite, toroidal, and other high-frequency transformers used in telecom equipment, medical devices, industrial electronics, power supplies, EV charging systems, and electronic applications. The business has a strong export presence and serves OEMs across global markets.
3.2 Company Journey
3.3 Diversified Applications
3.4 Diversified Product Profile
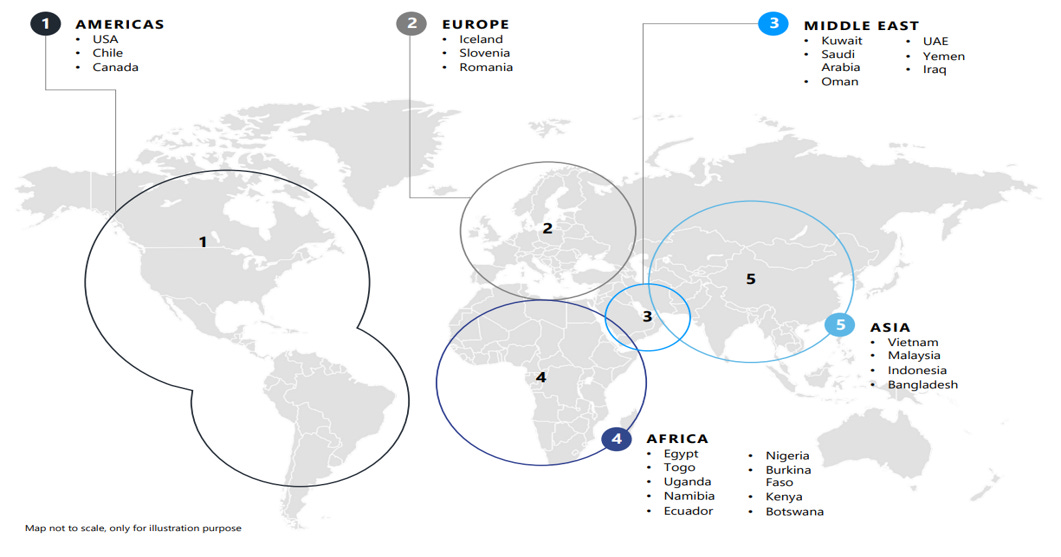
3.5 Global Footprint
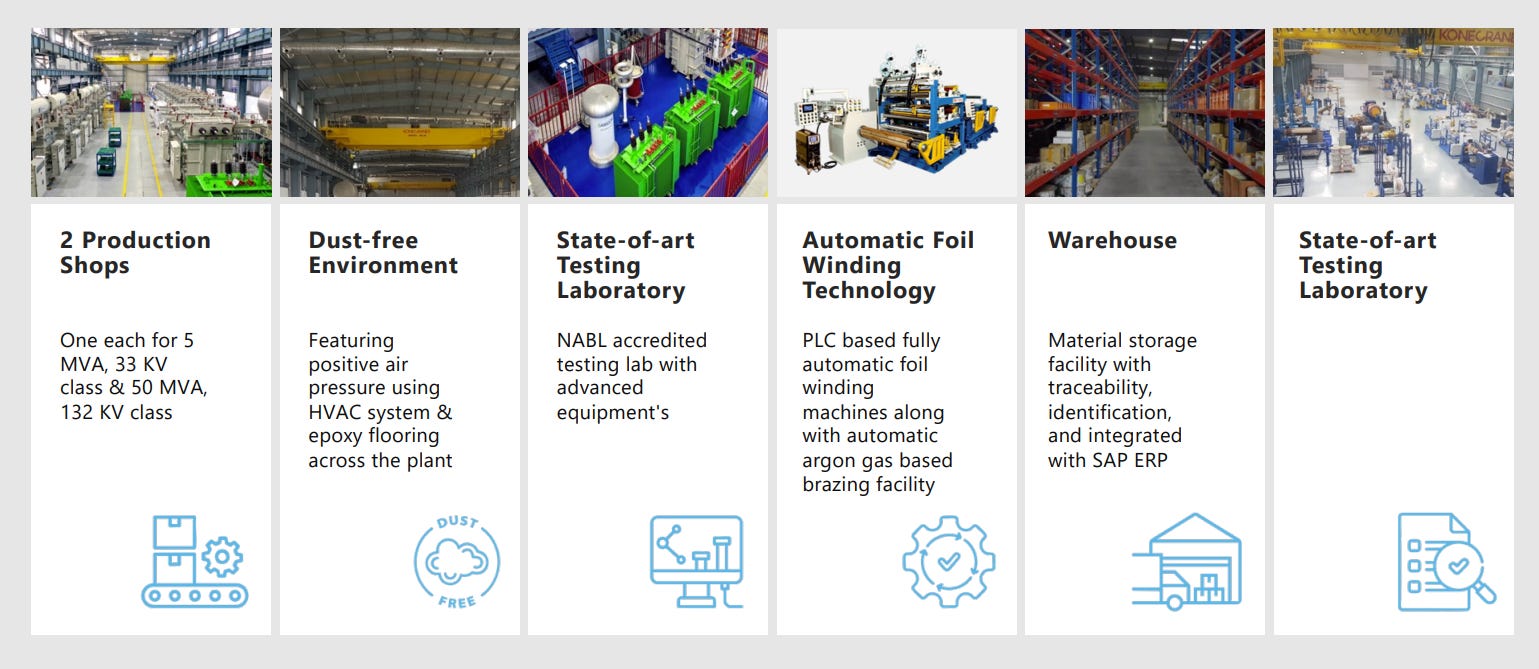
3.6 Company Infrastructure
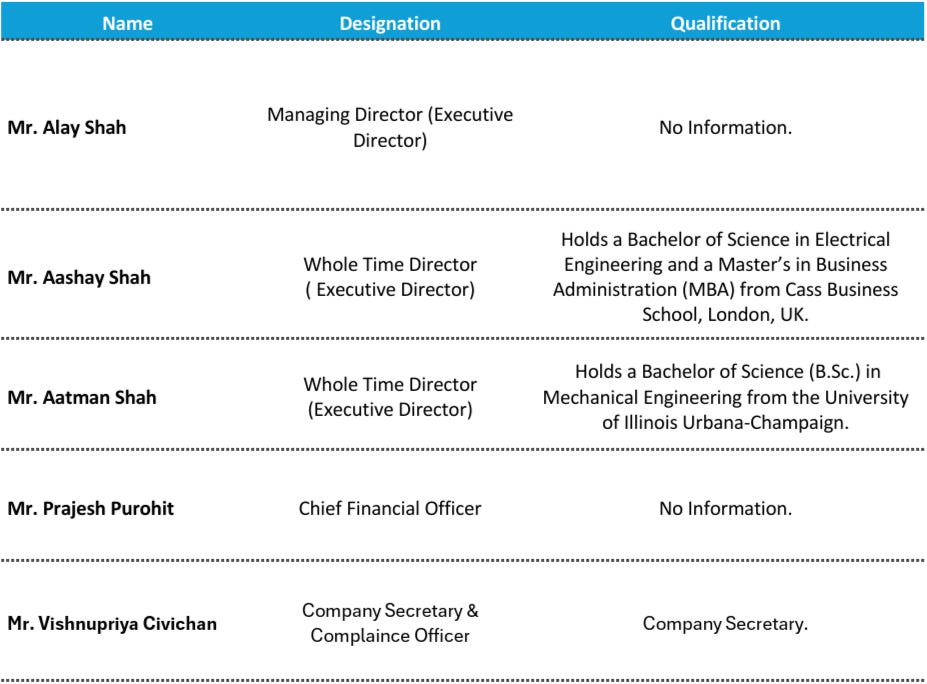
4. Management Overview:
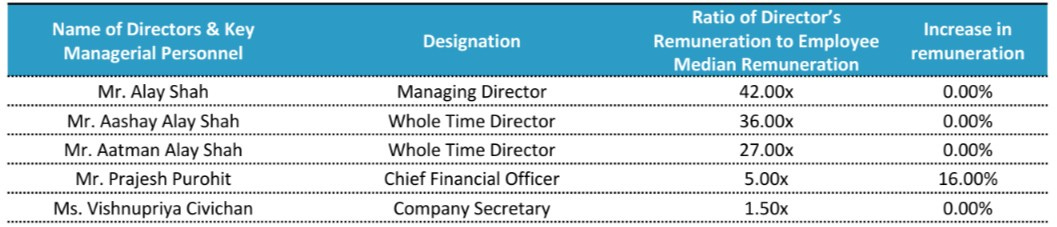
4.1 KMP’s Remuneration:
5.1 QUARTERLY ANALYSIS:
(Read detailed Quarterly Analysis in the Premium Version)
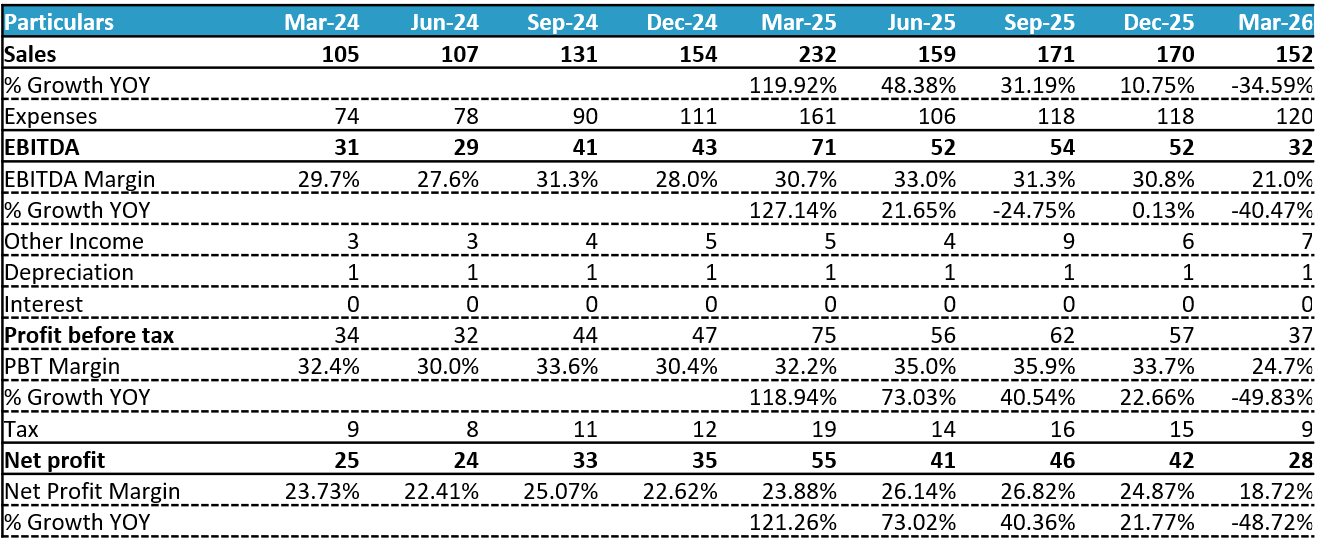
Growing at a CGR of 4.6% in last 9 Quarters.
Growing at a CGR of 0.2% in last 9 Quarters.
Growing at a CGR of 1.6% in last 9 Quarters.
5.2 ANNUAL ANALYSIS:
(Read detailed Annual Analysis and Forecasts in the Premium Version)
5.2.1 Revenue:
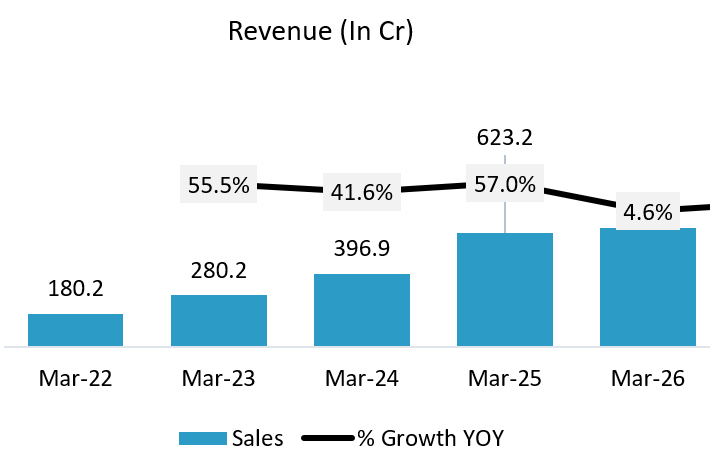
4Y CAGR: 37.9%
Revenue stagnation till FY22, then the break
Revenue between FY17 and FY21 bounced between ₹71 cr and ₹118 cr with no real trend, essentially flat for five years.
This tracked the broader Indian transformer industry, which carried structural overcapacity through most of the 2010s, with utilisation across the sector averaging 60 to 70% and pricing under sustained pressure. Domestic power sector capex additions slowed through the decade on fuel shortages and project delays, and FY20-21 added COVID disruption on top.
FY22 is where the story actually turns, and it turns hard. Export income roughly tripled from ₹45.7 cr in FY22 to ₹144.8 cr in FY23, driven by international demand for renewable-linked transformers, particularly from the US and Middle East.
Domestically, the company’s core product, inverter duty transformers for solar and wind, sat directly in the path of India’s renewable buildout toward the government’s 500 GW target. Capacity additions followed rather than led this demand. That combination, export breakout plus a domestic tailwind arriving at the same time, is what took a decade of going nowhere and turned it into a five-year compounding story.
5.2.2 Gross Profit:
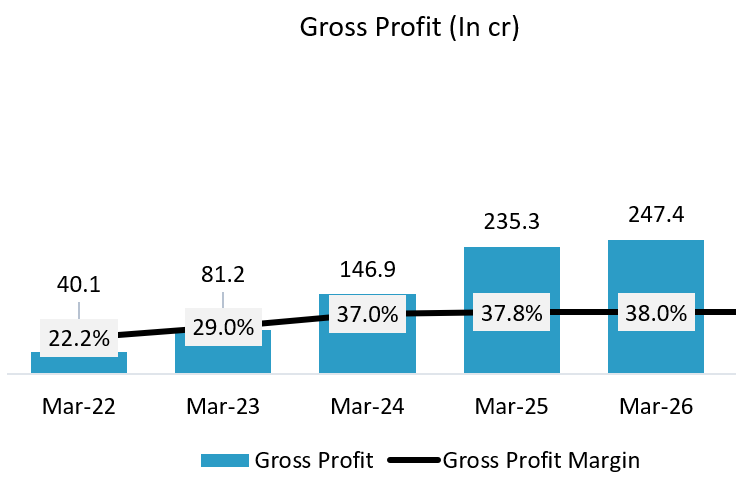
4Y CAGR: 57.6%
Gross margin improvement since FY22 (22.2% to 38.0%)
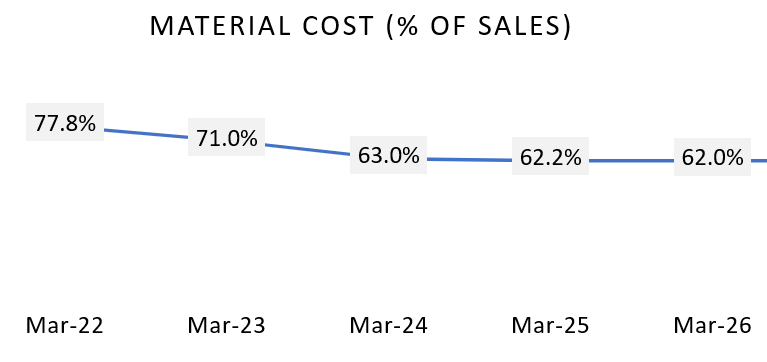
Material cost is the whole story here, falling from 77.8% of sales in FY22 to 62.0% in FY26. The two dominant inputs for a transformer are CRGO steel (cold rolled grain oriented steel, used for the core) and copper (used for windings), alongside aluminium conductor and transformer oil in smaller proportion. Brokerage commentary from FY23-24 attributes the margin jump specifically to cooling copper and CRGO steel prices industry-wide during that period.
Mix also helped. Export realisation runs meaningfully higher than domestic (management has cited roughly ₹10 to 11 lakh per MVA), so the growing export share added a second lever on top of the input cost relief. Both forces worked in the same direction, which is a big part of why the improvement was this sharp.
5.2.3 EBITDA:
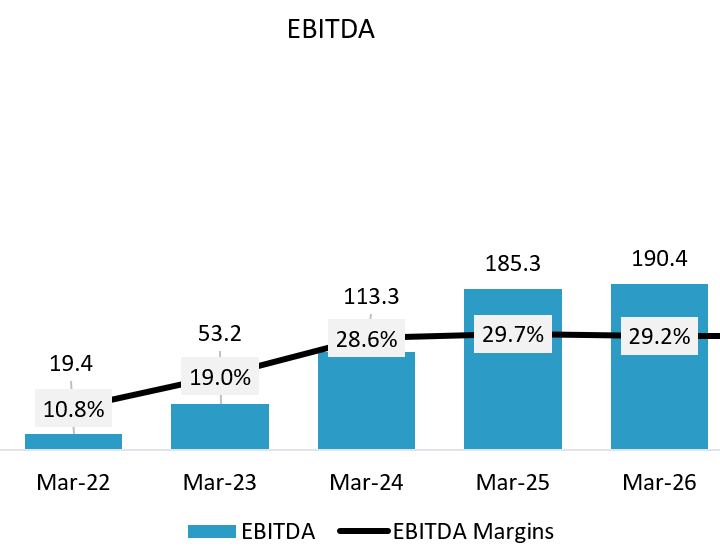
4Y CAGR: 77.0%
EBITDA margin expansion (10.8% to 29.2%):
This is largely gross margin flowing straight through, plus operating leverage on top. Employee cost and selling and admin cost fell from a combined ~5% of sales in FY22 to roughly 4% in FY26, not because absolute spend shrank but because revenue grew 3.6x while the fixed cost base didn’t need to scale at the same pace.
Add the export mix shift toward better-realising products, and the combination pushed EBITDA margin up almost 19 percentage points in five years, a rate of margin expansion this business had never shown before FY22.
5.2.4 Net Profit:
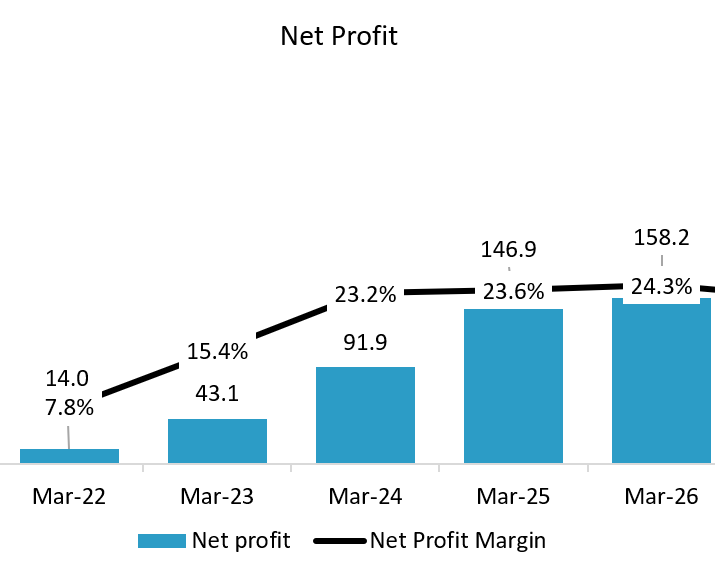
4Y CAGR: 83.2%
PAT growth and margin (7.8% to 24.3%)
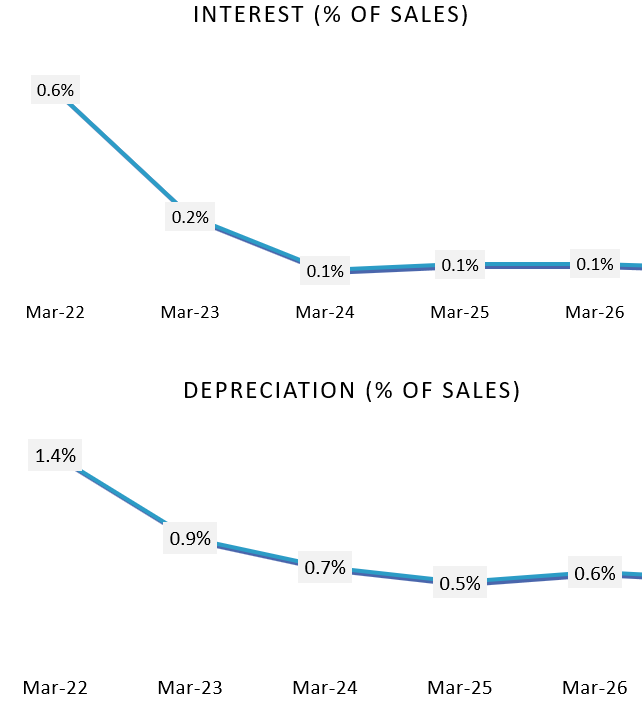
PAT margin expansion mirrors EBITDA margin expansion for the most part, but two smaller levers added on. Other income grew from ₹3 cr to ₹26 cr, rising from under 2% to 4% of sales, largely interest earned on LC-backed receivables that the company chooses not to encash early given its surplus cash position.
Depreciation and interest both shrank further as a share of sales, the company being effectively debt free with interest coverage at 452 times by FY26. Tax rate held steady around 25.5% throughout, so none of the margin gain came from tax. Net effect: PAT grew faster than EBITDA in percentage terms across the five years, from ₹14 cr to ₹158 cr.
5.2.5 Balance Sheet:
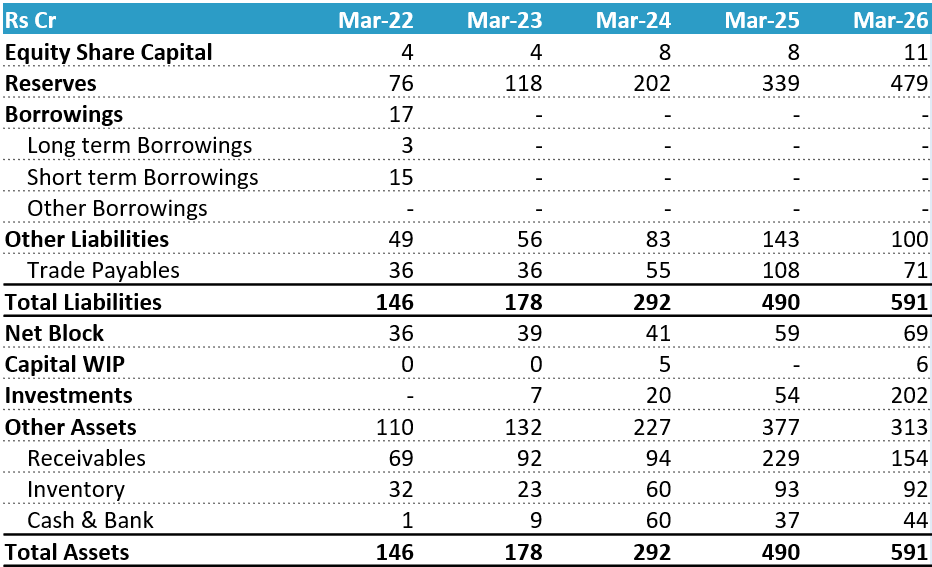
How the company runs debt free?
Borrowings dropped from ₹17 cr in FY22 to zero from FY23 onward. Both capacity expansions since then, the move to 7,500 MVA and now the 6,500 MVA Gavasad project, have been funded entirely through internal accruals. The business generates enough cash to cover it: EBITDA margins of 29 to 30%, operating cash flow of ₹192 cr in FY26, and reserves that grew from ₹76 cr to ₹479 cr in five years.
A large share of receivables also sit against 180-day letters of credit. Management has said they could encash these within 30 days if they needed the cash, but choose to hold till maturity instead, since that earns interest booked as other income. A company doing that isn’t scraping by without debt, it’s simply not needed.
Why receivables fell in FY26?
Receivables dropped from ₹229 cr to ₹154 cr even though revenue grew. This is a base effect. Q4FY25 was a ₹232 cr quarter, the biggest in the company’s history, and with billing concentrated at year end, that inflated the FY25 closing receivables. Q4FY26 came in at just ₹152 cr, down 34.6% YoY, on the tariff-led order softness and the Middle East shipping disruption. A smaller Q4 produces a smaller receivables balance at close, nothing more.
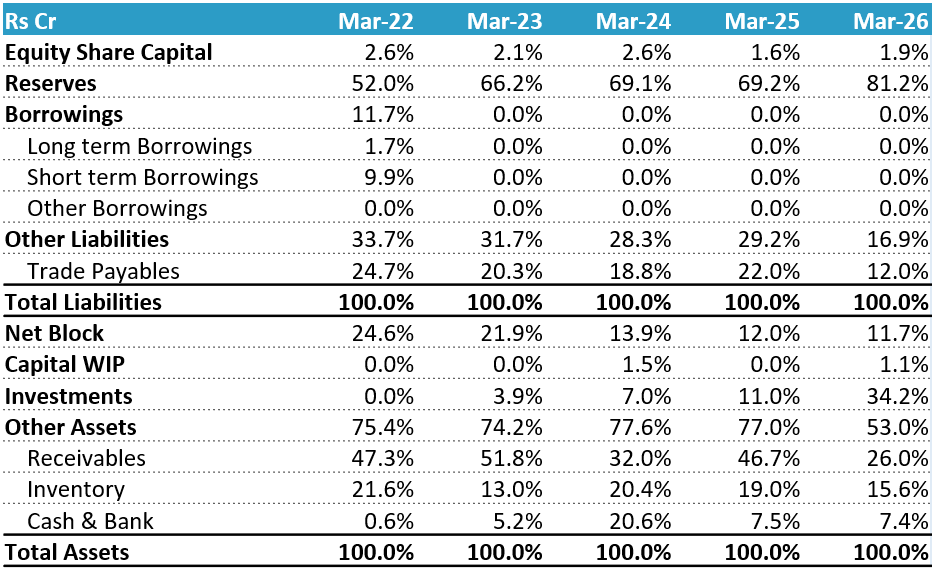
5.2.6 Common-Size Balance Sheet:
5.2.7 Cash Flow Analysis:
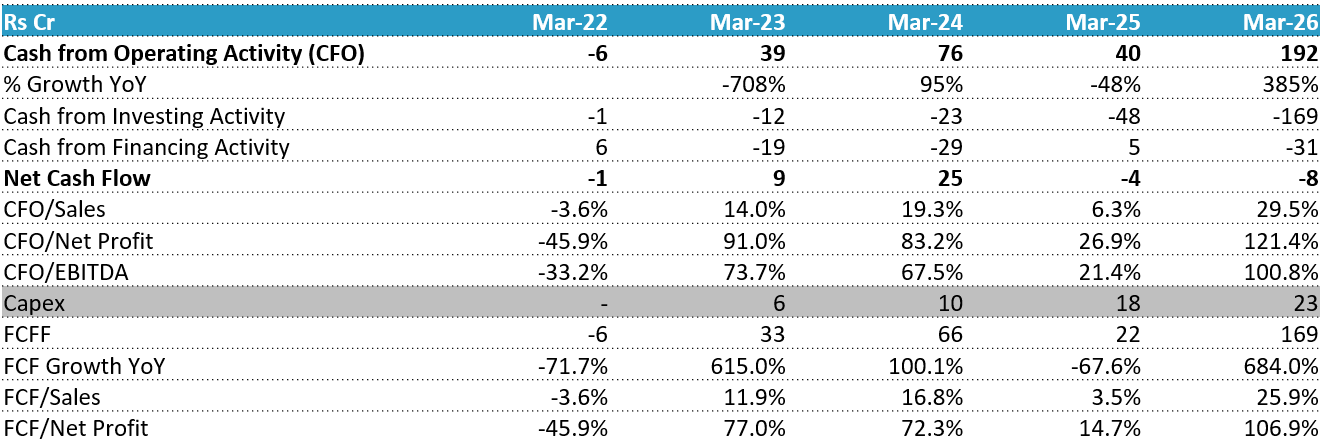
CFO jump in FY26 (₹40 cr to ₹192 cr)
Profit from operations rose from ₹199 cr to ₹218 cr. The main swing is in working capital, which went from a ₹116 cr drag in FY25 to a ₹37 cr addition in FY26, a shift of ₹153 cr.
Receivables account for most of it. FY25 saw receivables build by ₹136 cr, cash tied up mostly from the ₹232 cr Q4FY25 quarter sitting on the books at year end. FY26 saw the opposite: receivables released ₹72 cr, in line with the weak Q4FY26 dispatches meaning less billing at year end and less cash locked in debtors. Inventory was flat (+1) versus a ₹34 cr build in FY25.
Payables moved the other way, a ₹37 cr outflow as the company paid down suppliers, versus a ₹53 cr inflow last year. Working capital moved from the main drag on cash to a contributor, and that explains most of the CFO increase.
CFI dip in FY26 (₹48 cr to ₹169 cr outflow)
Mainly one line: Investments purchased rose from ₹33 cr to ₹148 cr. This matches the balance sheet, where Investments went from ₹54 cr to ₹202 cr while Cash & Bank stayed roughly flat. Fixed asset purchases also rose, from ₹18 cr to ₹23 cr, tracking the Gavasad expansion.
What exactly these investments are, mutual funds, fixed deposits, or otherwise, isn’t specified in public filings or the sources we checked; that detail sits in the annual report notes. The pattern points to surplus operating cash being parked in short-term instruments rather than held as plain cash.
CFF dip in FY26 (₹5 cr inflow to ₹31 cr outflow)
Dividend paid rose from ₹9.53 cr to ₹14.30 cr, consistent with the ₹12.50 per share payout on a larger post-bonus share base (equity share capital rose from ₹8 cr to ₹11 cr in FY26, tracking the 1:2 bonus issue approved the prior year).
Other financing items flipped from +₹14.54 cr in FY25 to -₹16.19 cr in FY26, a swing of over ₹30 cr. We could not confirm the exact composition from public sources; it may relate to lease liability movements or a reclassification tied to the bonus issue completing during the year.
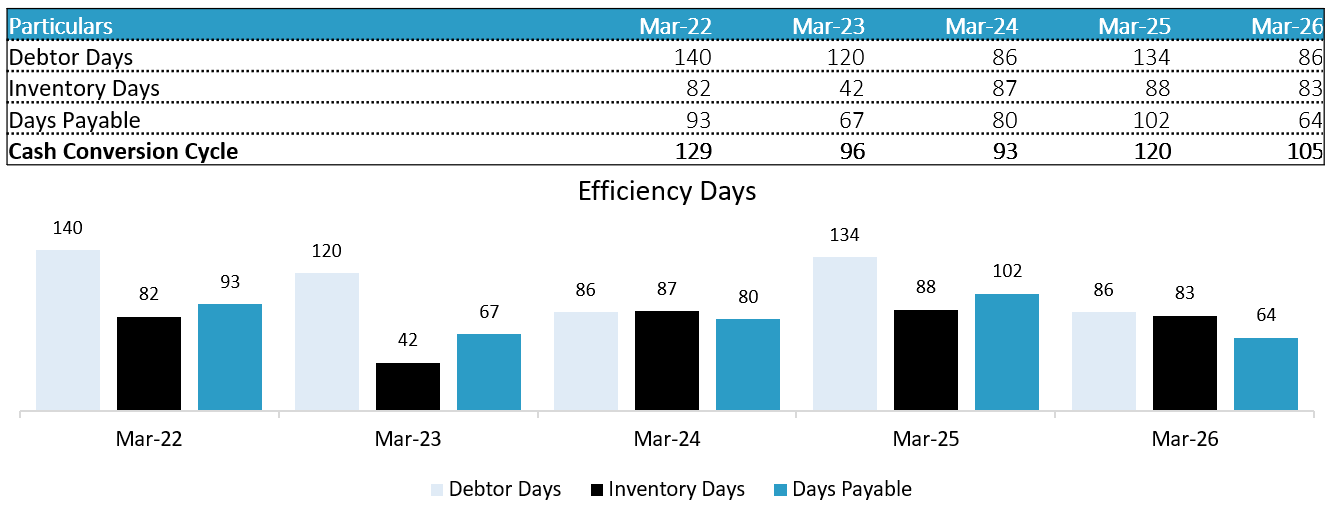
5.2.8 Cash Conversion Cycle:
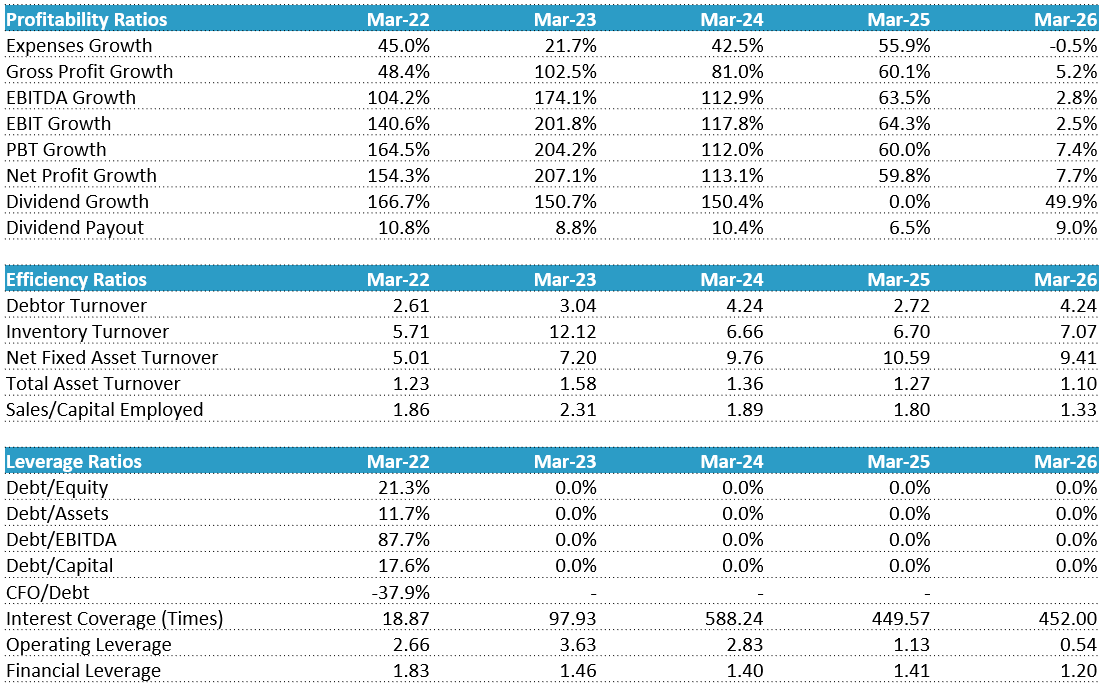
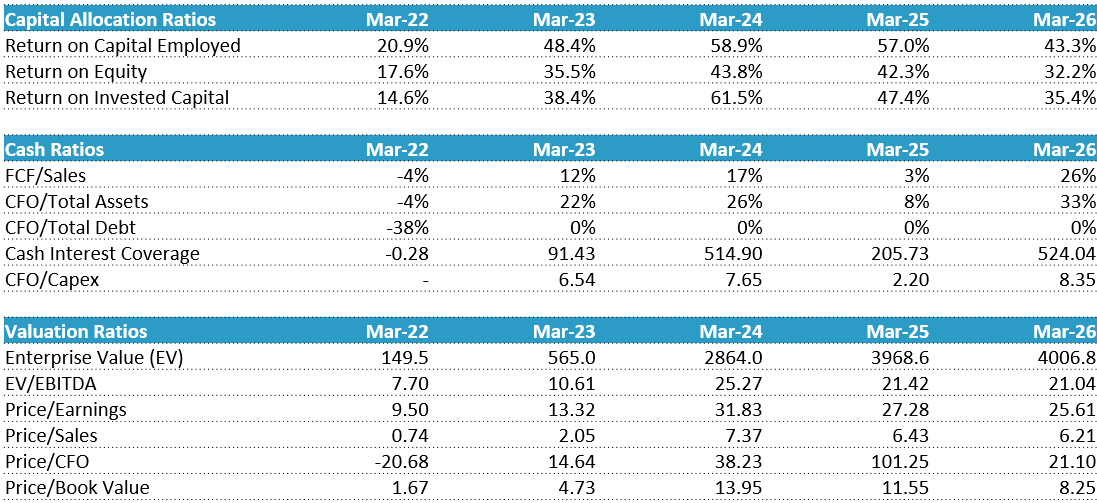
6. Key Ratios:
7. Shareholding Pattern:
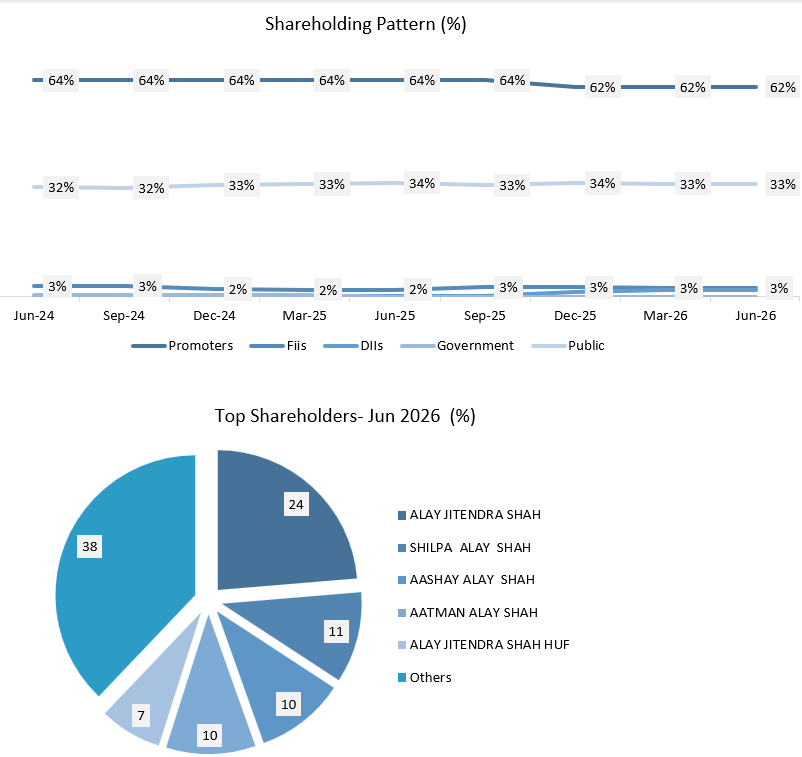
Although the holdings are fairly stable, 33% of public holding can be a point of concern. If geopolitical tensions go south, panic will come first from public’s side leading to panic selling even if the business is fundamentally strong.
8. Con-call Analysis (Q4 FY26):
1. Performance Overview: A Year of Strong Compounding Tempered by Q4 Headwinds
Q4 FY26 Slowdown: The fourth quarter faced external pressures, with revenue coming in at INR 152 crores, EBITDA margins compressing to 21%, and PAT at INR 28 crores. This softer-than-expected performance was attributed by management to two distinct, temporary external events:
US Tariff Policy Ambiguity: Policy uncertainty in preceding quarters (particularly Q3, when a tariff of 50% on Indian goods was feared before settling at 10%) temporarily slowed order intake from US customers. While orders recovered in Q4, actual dispatches remained slow due to the lead-time gap.
Middle East Logistics Disruptions: In March 2026, a substantial volume of export shipments destined for the Middle East valued between INR 35 crores and INR 40 crores could not be dispatched due to logistical and transit disruptions in West Asia. These shipments were deferred to Q1 FY27 rather than cancelled.
2. Strategic Initiatives & Growth Levers
To sustain its long-term growth trajectory, Shilchar is executing capacity expansions, upgrading its technology profile, and managing supply-chain risks.
Gavasad Capacity Expansion (Phase 3):
The company is executing a major brownfield expansion at its Gavasad facility, which will add 6,500 MVA of capacity. This will increase the company’s total installed capacity from 7,500 MVA to 14,000 MVA.
Status & Funding: Civil foundation work is complete, with PEB (Pre-Engineered Building) erection and utility infrastructure underway. The INR 120 crore capex is being funded entirely through internal cash accruals, preserving the company’s debt-free status. Commissioning is on track for April 2027.
Upgrading to Higher Voltage Classes (220 kV): The upcoming Gavasad expansion will enable Shilchar to manufacture larger transformers up to 160 MVA in the 220 kV voltage class (extending beyond its current product limit of 132 kV). This shift expands the company’s addressable market to higher-end power transmission and utility projects. Management plans to seek PGCIL (Power Grid Corporation of India Limited) and other utility approvals as soon as the facility is commissioned.
Capitalizing on Domestic Renewable Energy Expansion: India commissioned a record 55 GW of renewable energy capacity in FY26. This domestic momentum continues to drive robust order inflows for Shilchar’s solar and wind transformer segments, including Inverter Duty Transformers (IDTs).
Mitigation of Component Shortages (Bushings): To address the global industry-wide shortage of critical condenser bushings required for higher-voltage transformers, Shilchar has secured a reliable domestic supply partner, Yash Highvoltage (based in Vadodara), and is planning imports from China. The company is maintaining buffer inventory to offset long supplier lead times.
3. Capacity & Future Targets
FY27 Volume and Utilization Targets: For FY27, management is targeting dispatches of approximately 7,000 MVA, up from nearly 6,000 MVA in FY26 (where the effective dispatch-based utilization was 79%). Had the delayed Middle East shipments been dispatched in March, FY26 utilization would have reached 82% to 83%. Management aims to run the existing 7,500 MVA facility at close to 90%–95% utilization in FY27.
FY27 Revenue Guidance: The company has provided a conservative top-line target of INR 800 crores to INR 850 crores for FY27, supported by a current healthy order book of INR 452 crores.
Long-Term Revenue Potential: Once the new 14,000 MVA capacity is fully commissioned in April 2027 and subsequently ramped up, the total infrastructure will be capable of supporting a top-line turnover of approximately INR 1,500 crores. The full financial impact of this expansion is expected to be visible by FY29 or FY30.
4. Margin Analysis & Raw Material Headwinds
Gross Margin Compression: Q4 FY26 margins were compressed by a less favorable product mix and raw material cost inflation.
Product Mix Shift: Export sales typically yield higher margins than domestic sales. The delay in Middle East exports in March shifted the quarter’s revenue mix to INR 52 crores in exports versus INR 100 crores in domestic sales, lowering average margins.
Commodity Price Inflation: Raw material prices rose across the board, with transformer oil prices doubling (a 100% increase) between February and May 2026. Other commodities, such as copper and aluminum, rose by 10% to 25%. Transformer oil accounts for approximately 8% to 12% of the total transformer cost.
Pricing Power and Contract Renegotiation:
To counter raw material inflation, Shilchar has approached customers to negotiate price increases. Several domestic customers have already accepted revised prices, enabling the resumption of shipments.
For fixed-price orders, the company is using the recent commodity price surge as a force majeure-like negotiation point. New inquiries are being quoted at higher prices to reflect current raw material realities.
A portion of the existing order book is protected by Price Variation (PV) clauses linked to standard IEEMA indices, insulating those contracts from raw material volatility.
EBITDA Margin Outlook: Despite short-term raw material pressures, management aims to maintain its long-term EBITDA margin guidance of 29% to 31%.
5. Working Capital & Capital Structure
Debt-Free Status: Shilchar remains entirely debt-free, financing its operations and capital expenditure through internal cash generation.
Liquidity Position: As of March 31, 2026, the company held cash and cash equivalents of INR 246 crores, providing a solid cushion to execute its INR 120 crore expansion plan without relying on external borrowings.
Cash Flow and Inventory Management: Operating cash flow for FY26 was strong at INR 192 crores. Year-end inventory stood at approximately INR 100 crores (comparable to last year’s level of INR 92 crores). When the shipping disruptions began in early March, management chose to halt final assembly to avoid accumulating finished goods, holding the assets as work-in-progress (WIP) to prevent storage and handling bottlenecks.
6. Key Q&A Insights
Export and Regional Exposure: Exports to the Middle East account for approximately 30% of Shilchar’s total revenue across FY25 and FY26. The US market currently represents 18% to 19% of total revenue. After a period of volatility caused by the threat of a 50% tariff on Indian goods, tariffs have stabilized at 10%, restoring the competitiveness of Indian exports to the US.
Lead Times: Current lead times for power transformers remain stable at 12 to 16 weeks.
Capacity Utilization vs. Production: Management clarified that the reported 79% capacity utilization for FY26 was calculated purely based on dispatched volumes (6,000 MVA). Actual production utilization was higher, with the excess volume held in inventory as closing stock to be dispatched in Q1 FY27.
9. SWOT ANALYSIS:
Strengths
Strong Industry Expertise: Over 40 years of manufacturing experience, including 26 years in transformers and 17 years in renewable energy transformer solutions, supported by exports to 25+ countries.
Integrated Manufacturing Campus: Operates a 17-acre, 1.6 lakh sq. ft. facility in Vadodara with 475+ employees, enabling centralized production and quality control.
High-Quality Production Environment: Dedicated dust-free production shops with positive-pressure HVAC systems ensure superior manufacturing standards for critical transformer components.
Diversified Global Presence: Strong export footprint across the Americas, Europe, Middle East, Africa, and Asia reduces dependence on a single market.
Weaknesses
Export Market Concentration: Around 30% of exports are routed through the Middle East, exposing operations to regional disruptions and logistics risks.
Limited Capacity Headroom: Current utilization of nearly 80% leaves limited room for growth before the next expansion comes online.
Commodity Price Sensitivity: Rising copper and aluminum prices directly affect manufacturing margins and cost competitiveness.
Weak Cost Pass-Through Mechanism: Fixed-price contracts often require renegotiation to recover input cost increases, delaying margin protection.
Opportunities
Major Capacity Expansion: The ongoing Expansion #3 project will nearly double capacity from 7,500 MVA to 14,000 MVA by FY27.
Entry into Higher Voltage Segments: New facilities will enable manufacturing of transformers up to 160 MVA and 220 KV, expanding the addressable market.
Expanded Manufacturing Infrastructure: Addition of 1.1 lakh sq. ft. of shop-floor space will support higher production volumes and operational flexibility.
Flexible Capacity Utilization: New facilities can initially manufacture standard renewable transformers while awaiting approvals for higher-voltage products.
Threats
Critical Component Shortages: Dependence on specialized components such as bushings exposes production schedules to supply chain disruptions.
Industry-Wide Capacity Additions: Simultaneous expansions by competitors may create overcapacity and pricing pressure in the future.
Supplier Renegotiation Risks: Commodity inflation may lead suppliers to delay deliveries or seek price revisions on existing orders.
Trade Policy Uncertainty: Export growth remains vulnerable to tariffs and changing international trade regulations.
10. Competitors:
10.1 Indo Tech Transformers Ltd.

Market Cap: ₹ 3,612 Cr.
Indo Tech Transformers Ltd., headquartered in Chennai, Tamil Nadu, operates in the Power Equipment and Electrical Equipment Industry. The company manufactures power transformers, distribution transformers, special application transformers, and substation equipment, catering to utilities, renewable energy developers, industrial customers, and infrastructure projects.
Business Model:
Indo Tech follows a manufacturing-led B2B business model, supplying transformers for power generation, transmission, and distribution applications.
Its product portfolio includes power transformers, distribution transformers, inverter-duty transformers, and specialty transformers.
Revenue is generated through:
Sales to state and private power utilities.
Supplies to renewable energy projects (solar and wind).
Industrial and commercial infrastructure projects.
Export orders and EPC contractors.
The company benefits from increasing investments in grid modernization and power infrastructure.
What Sets Them Apart:
Transformer Manufacturing Expertise: Over four decades of experience in transformer design and manufacturing.
Strong Presence in Power & Renewables: Supplies to utilities, industries, and renewable energy projects.
High-Quality Engineering: Focus on customized and high-efficiency transformer solutions.
10.2 Voltamp Transformers Ltd.
Market Cap: ₹ 9,634 Cr.
Voltamp Transformers Ltd., headquartered in Vadodara, Gujarat, operates in the Power Equipment and Electrical Equipment Industry. The company manufactures oil-filled power and distribution transformers, catering to power utilities, renewable energy projects, industrial customers, data centers, and infrastructure sectors.
Business Model:
Voltamp follows a manufacturing-led B2B business model, supplying transformers for power transmission, distribution, and industrial applications.
Its product portfolio includes power transformers, distribution transformers, and custom-built transformers.
Revenue is generated through:
Sales to industrial customers.
Supplies to power utilities and EPC contractors.
Renewable energy and infrastructure projects.
Exports to international markets.
The company benefits from strong demand driven by capacity expansion in power and industrial sectors.
What Sets Them Apart:
Market Leader: One of India’s leading manufacturers of oil-filled transformers.
Debt-Free Balance Sheet: Strong financial position with healthy cash generation.
Diversified Customer Base: Serves utilities, industries, renewable energy, and infrastructure sectors.
Strong Execution: Known for high-quality products and timely delivery.
Market Cap: ₹ 3.016 Cr.
10.3 Bharat Bijlee Ltd.

Bharat Bijlee Ltd., headquartered in Mumbai, Maharashtra, operates in the Power Equipment and Industrial Electrical Equipment Industry. The company manufactures power transformers, electric motors, drives, and automation solutions, serving power utilities, renewable energy, industrial, infrastructure, and OEM customers.
Business Model:
Bharat Bijlee follows a manufacturing-led B2B business model, supplying electrical equipment for power and industrial applications.
Its product portfolio includes power transformers, standard and customized electric motors, variable frequency drives (VFDs), and automation systems.
Revenue is generated through:
Sales of transformers and electric motors.
Industrial drives and automation solutions.
Supplies to utilities, EPC contractors, OEMs, and industrial customers.
The company benefits from rising investments in power infrastructure, industrial automation, and renewable energy.
What Sets Them Apart:
Diversified Product Portfolio: Presence across transformers, motors, drives, and automation.
Strong Industrial Presence: Serves utilities, manufacturing, infrastructure, and renewable energy sectors.
Engineering Expertise: Over seven decades of experience in electrical equipment manufacturing.
Focus on Energy Efficiency: Offers high-efficiency motors and automation solutions.
Thank You So Much For Reading!!
Researched By- Naresh, Mayank and Vaibhav
All information is sourced from the company’s annual reports, Press Release, News Articles, GoIndiastocks.in, Screener.in, industry reports, and Economy Outlook reports.
Disclaimer: We do not recommend buying or selling any stock. You should consult your financial advisor before buying or selling any financial instrument.
We are Proud to Announce Our New Launch of the Premium services where we Deep-dive into the Business and back you up with Robust Research.
We Provide services for different Level of Investors. You can Email us directly to start your journey!