Pyramid Technoplast Ltd.
Ramping up New Manufacturing Facilities!

Here at EquityEdge Research, we make Small-Cap Investing easy for you by Backing you up with Robust & Full-Fledged Research.
Please Fill the form Below if you are interested in our Services and would like a Free Sample of our Equity Research Report covering a Small/Micro-cap Company.
Read our Previous Report here:

Let’s go!
1. Key Highlights:

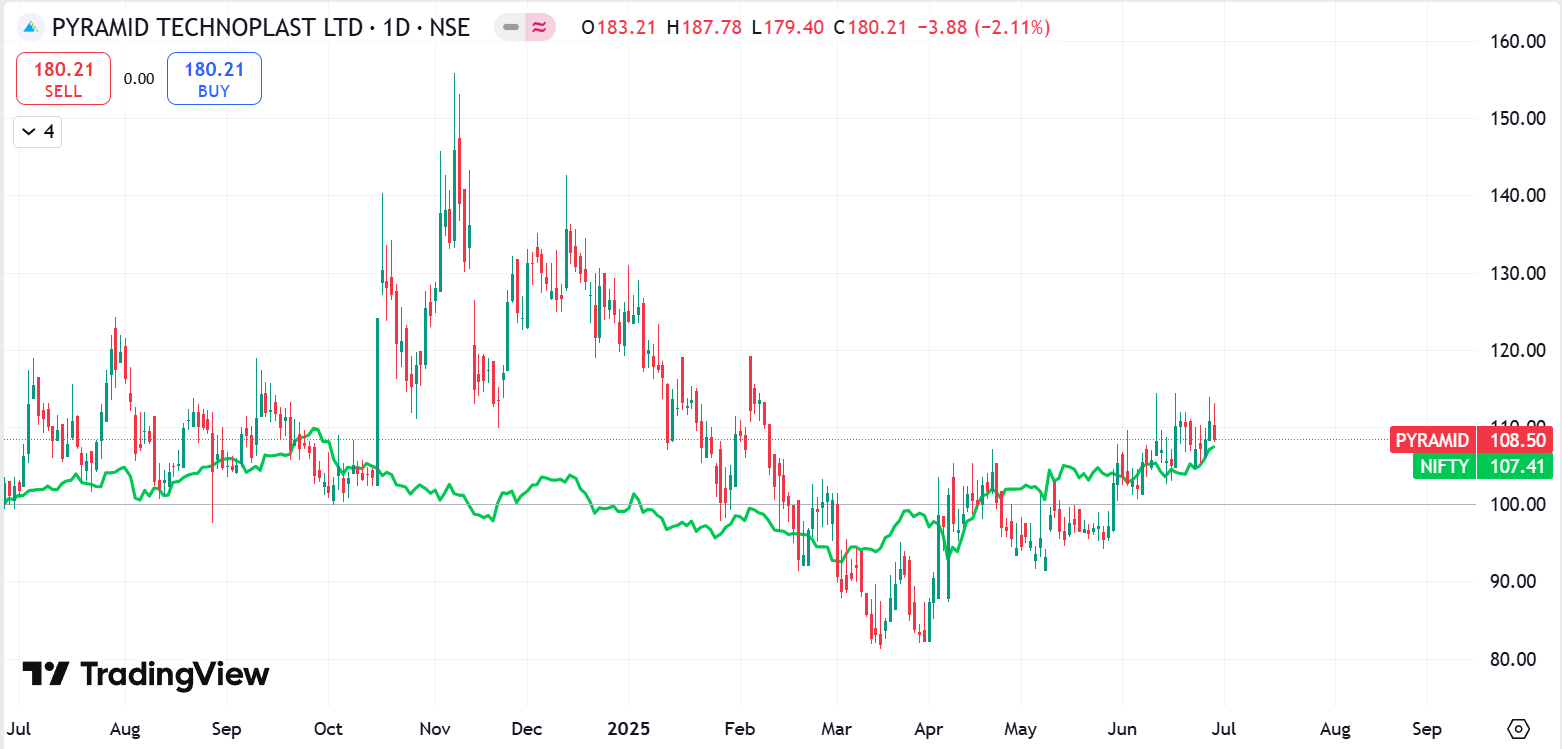
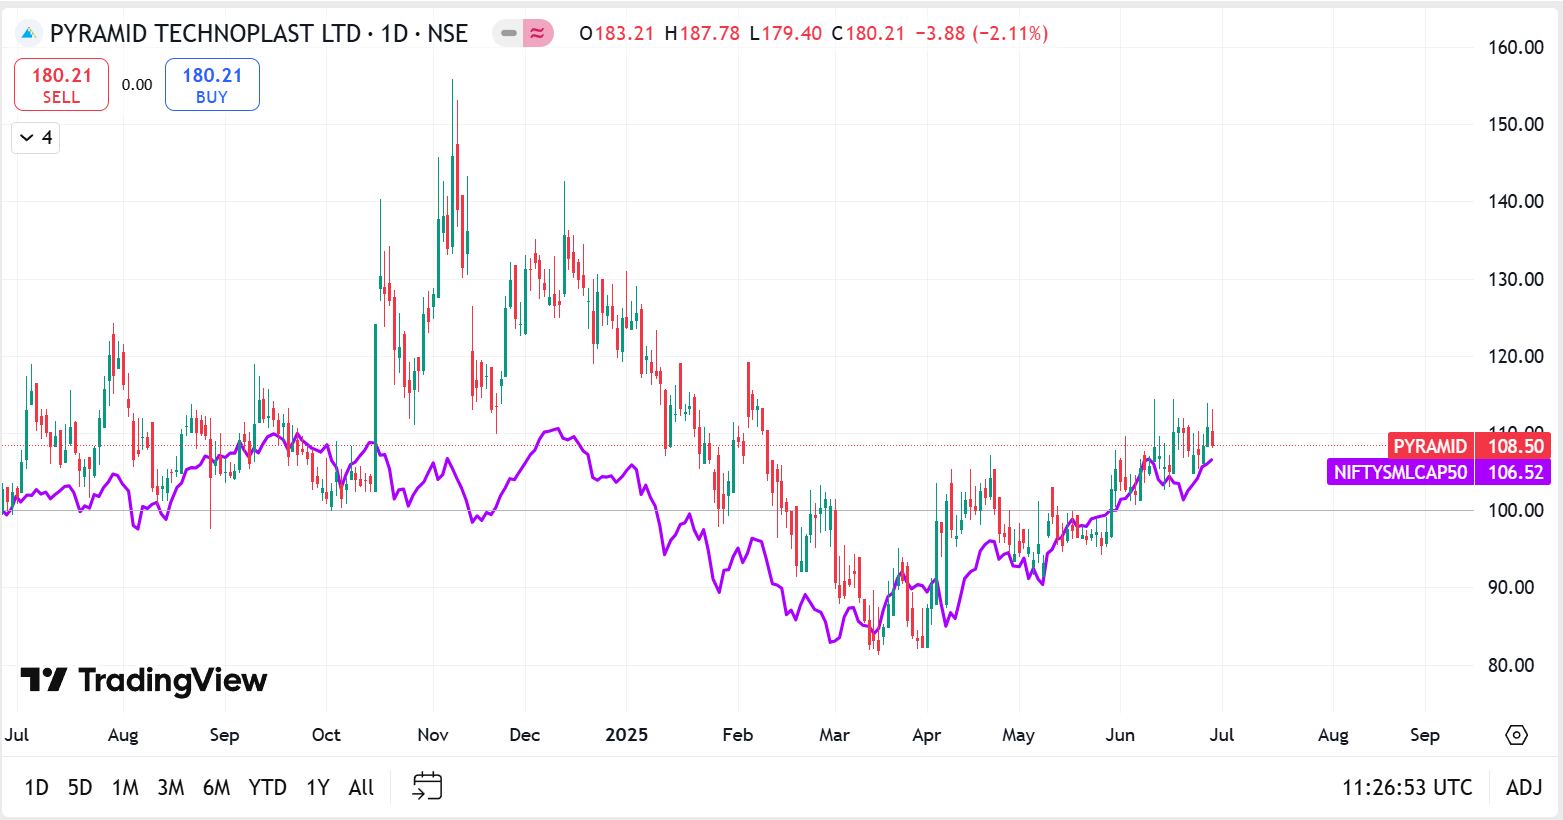
2. Company Chart Analysis:
*Comparison charts are Indexed*
Pyramid Technoplast Ltd. Performance

Pyramid Technoplast Ltd. vs. NSE Nifty
Pyramid Technoplast Ltd. vs. NSE Smallcap
3 About the Company

Pyramid Technoplast is an Indian industrial packaging company that manufactures polymer and steel-based containers used for storing and transporting chemicals, agrochemicals, pharmaceuticals, and food materials.
3.1 Business Segments
Polymer Drums (HDPE Barrels)
Manufactures blow-molded plastic drums used for safe transport of liquid and solid chemicals in sectors like agrochemicals, pharma, and food.Intermediate Bulk Containers (IBCs)
Produces 1,000-litre rigid plastic containers designed for bulk storage and transport of liquids and semi-solids.Mild Steel (MS) Drums
Makes durable steel drums used for packaging hazardous and non-hazardous industrial chemicals.
3.2 Company At Glance

3.3 Company Journey

3.4 Products
IBCs (Intermediate Bulk Containers)

Plastic Barrels

MS Drums

3.5 Customers

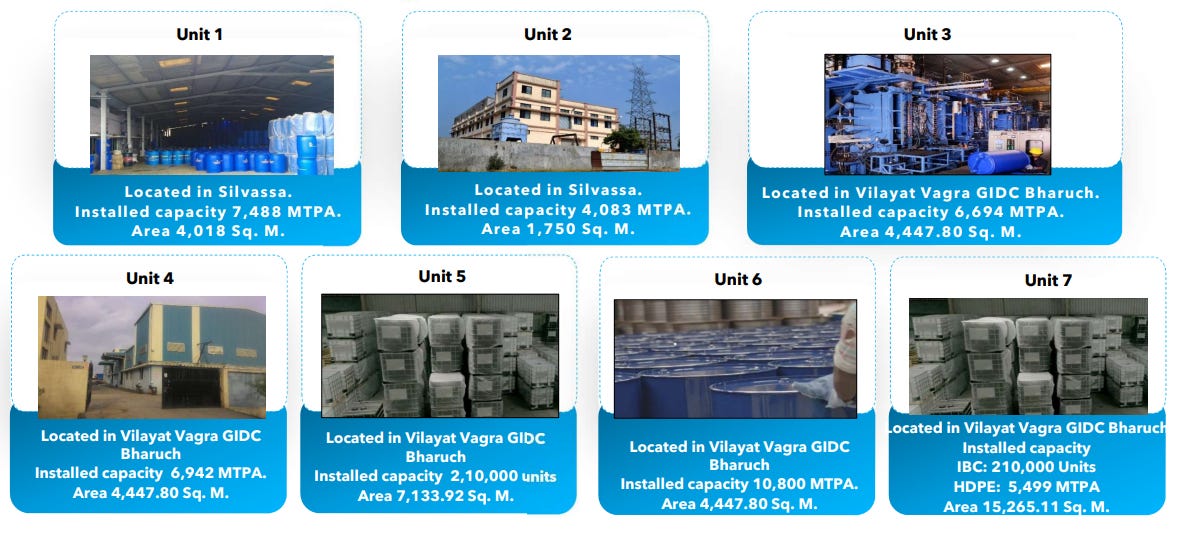
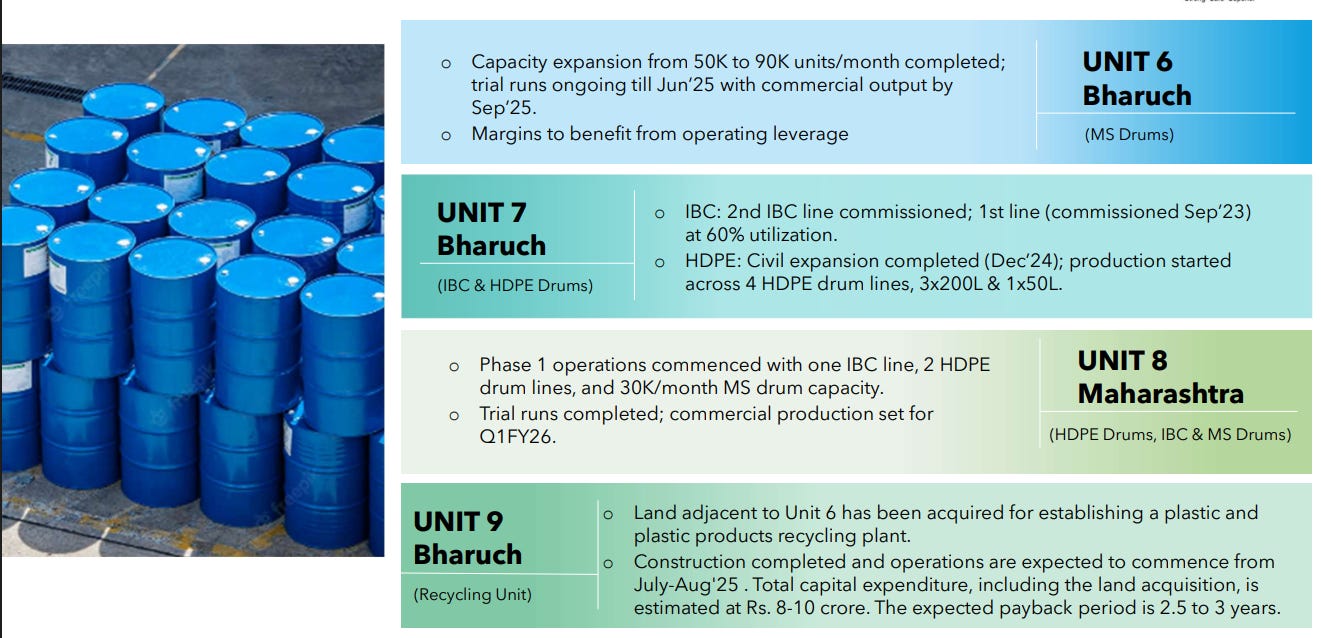
3.6 Manufacturing Facilities
3.7 Capex Update
3.8 Capex Trend & Outlook

Organic Growth & Green Energy Initiatives as of FY25, ₹69.8 Cr has been deployed toward capex. The planned outlay for FY26 and FY27 stands at ~₹50–60 Cr, each.
These investments will support the upcoming Maharashtra unit, expansion of Unit 6 and Unit 7, and the development of a ₹50 Cr captive solar power facility.
4. Management Overview:
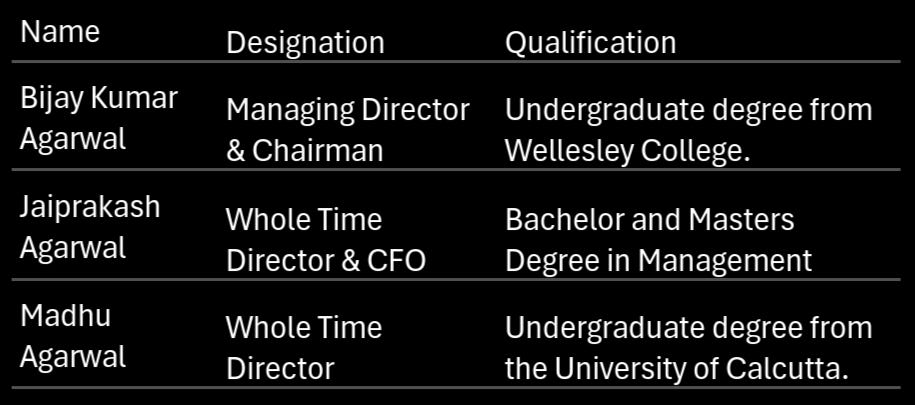
4.1 KMP's Remuneration

5. Revenue Breakdown:

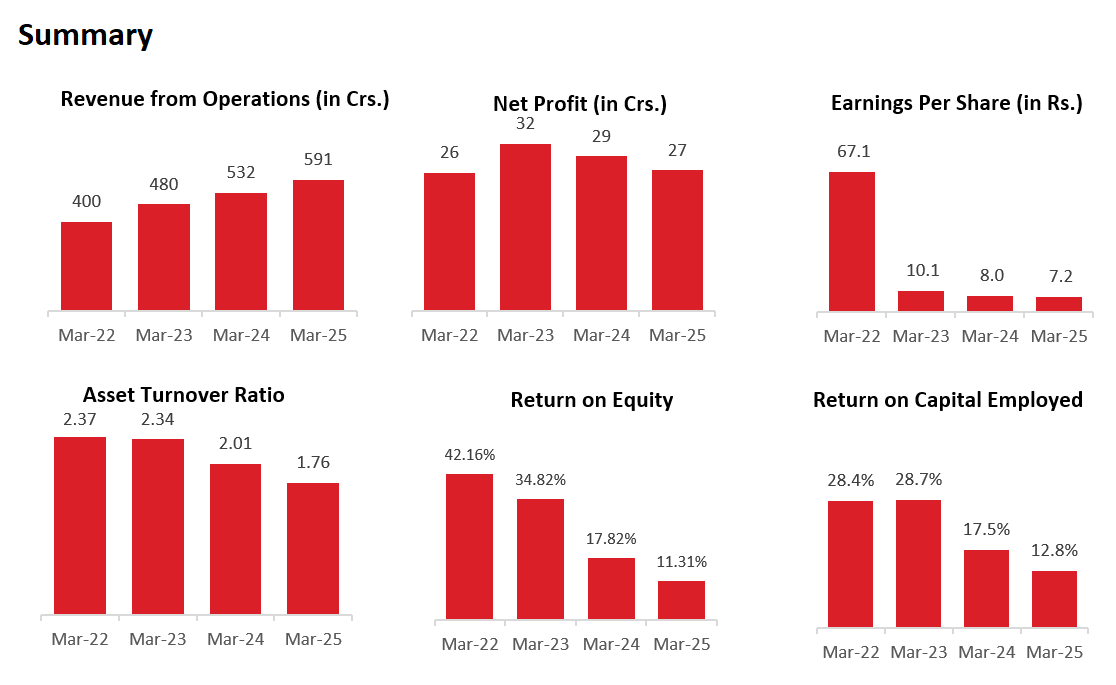
6. Company’s Financial Analysis:
6.1 REVENUE:
The Revenue has grown at a CAGR of ~17.93% in the past 6 years.
Apart from the stated facts in previous quarterly analysis, the revenue growth drop (on YoY basis) was due to:
Sharp Decline in Raw Material Prices Led to Lower Selling Prices: Raw material prices, especially polymer, fell from ₹105/kg to ₹95/kg in FY24 and remained low through FY25. Since Pyramid follows a cost-plus pricing model, selling prices dropped accordingly. Management clearly stated that revenue in FY24 was ₹46 crore lower purely due to this price correction, despite strong volume growth.
Lag Effect from Inventory Holding and Pricing Model: The company holds ~45 days of raw material inventory. During periods of falling prices, it ends up selling older, higher-cost inventory at lower market rates. This timing mismatch hit revenue realization in both FY24 and FY25, especially in Q2 and Q3 of FY24.
Capacity Expansions Were Delayed or Underutilized: New capacities at Unit 6 and Unit 7 were only partially contributing. For example, the IBC line at Unit 7 ran at only 50% utilization during FY24. The Maharashtra (Wada) unit, expected to add significant volume, will only contribute meaningfully from Q4 FY25 onward. Thus, new capacity didn't support revenue during most of this period.
Revenue Mix Impact from Trading Activities: The company recorded ₹55 crore of revenue in FY24 from trading raw materials, and ~₹25 crore in FY25. This comes at just 1–2% margins and adds little to core operating profit. It inflated top-line figures slightly but diluted overall revenue quality.

6.2 GROSS PROFIT:
The Gross Profit has grown at a CAGR of ~15.7% in the past 6 years. The Margin is stable and we expect it to be in the similar range for future.


6.3 EBITDA:
EBITDA has grown at a CAGR of 19.3% in past 6 years. The reasons for the fall in the margin is explain in Quarterly Analysis (Premium).

6.4 Net Profit:
Net Profit has grown at a CAGR 36.8% in past 6 years. The fall in margin is as expected because of fall in EBITDA Margin.

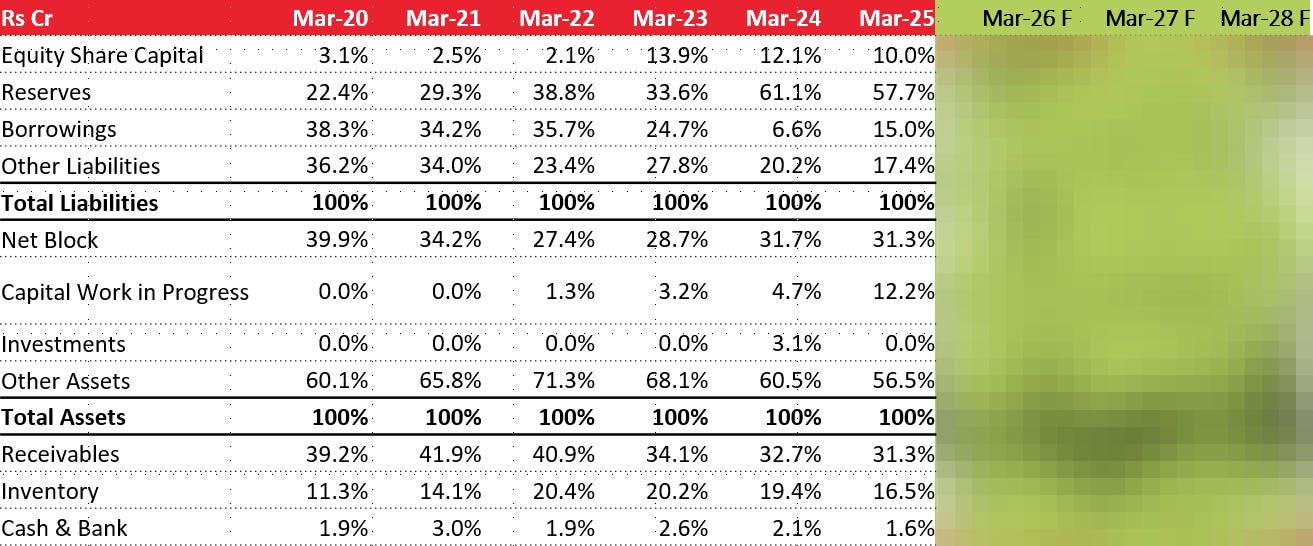
6.5 Balance Sheet:

6.6 Common-Size Balance Sheet:
6.7 Cash Flow Analysis:

6.8 Cash Conversion Cycle:

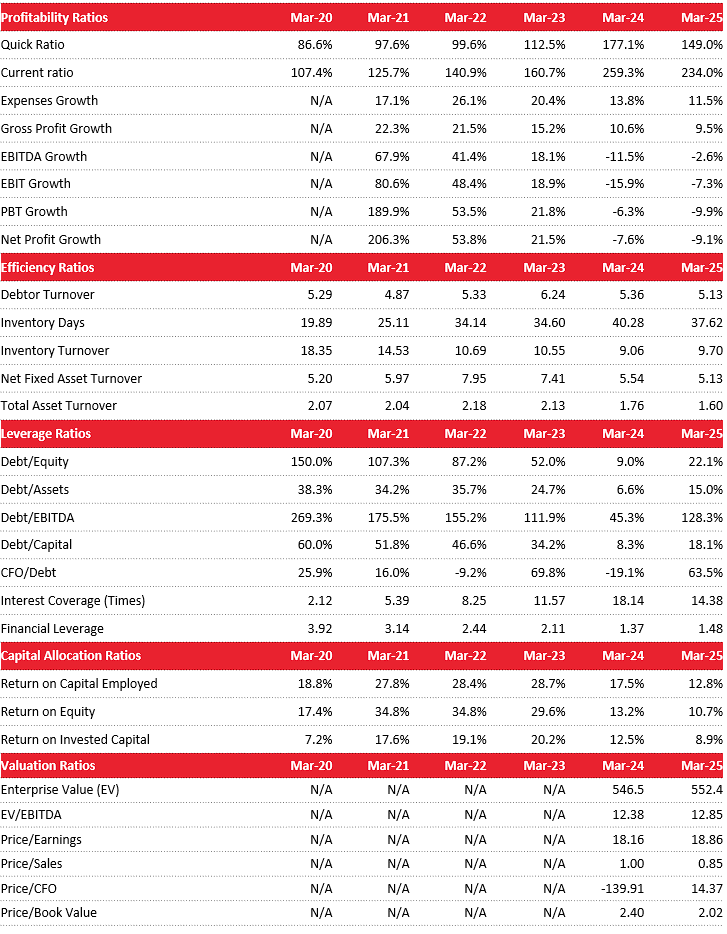
7. KEY RATIOS:
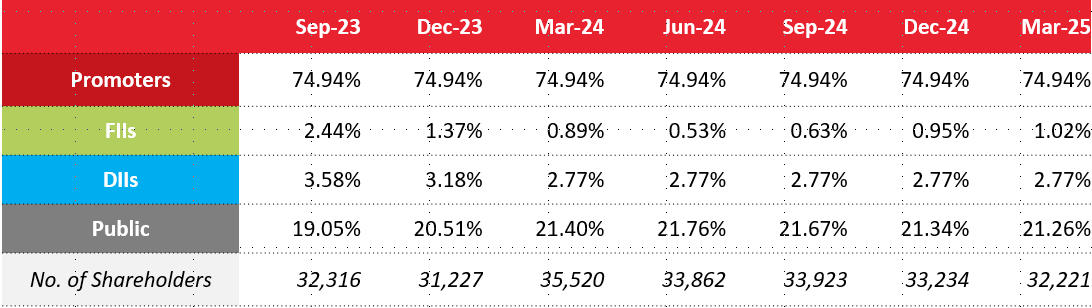
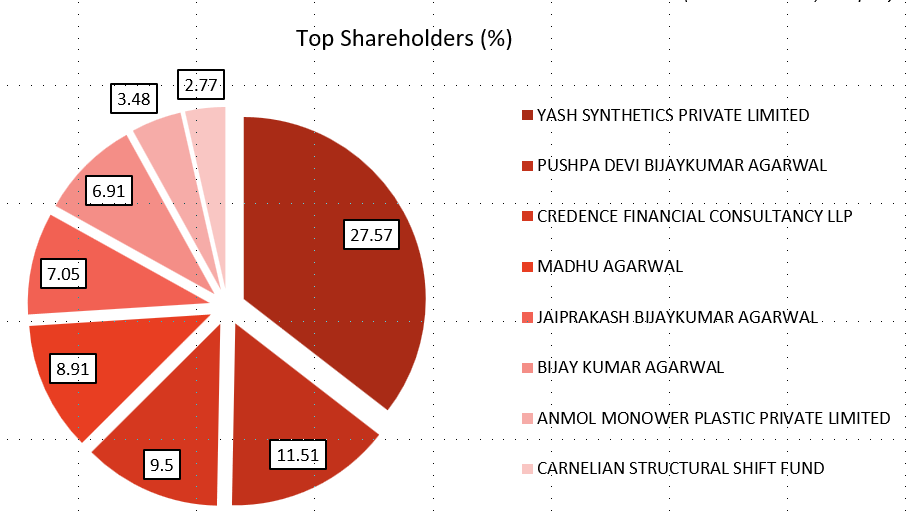
8. Shareholding Pattern:
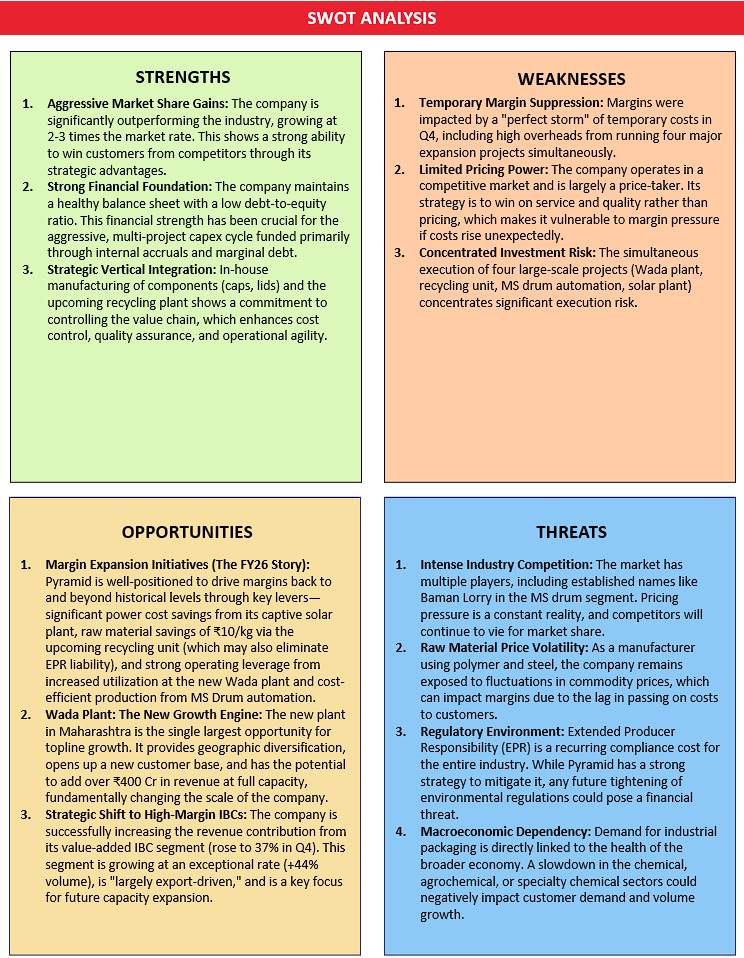
9. SWOT ANALYSIS:
10. Con-Call Analysis (Q4 FY25)
10.1 Overall Consolidated Performance
FY25 Financials (vs FY24):
Volume growth for FY25 was a strong 16%.
EPS: ₹7.38 (vs ₹8.49 FY24).
Margin Headwinds:
Q4 margin contraction is a "temporary uptick in cost" and was due to increased overheads of ₹4-5 Cr related to the simultaneous expansion of four projects, and a bunched-up, full-year Extended Producer Responsibility (EPR) cost of ₹1.5 Cr was booked in Q4.
This will normalize to a lower, quarterly run-rate in FY26.
Shareholder Value: Announced a maiden dividend of ₹0.50 per share for FY25.
10.2 Product Segments
Financial Performance (FY25 Revenue Mix):
Polymer Drums: ₹258 Cr.
IBC Business (Value-Added): ₹198 Cr.
MS Drums: ₹63 Cr.
Volume Growth (Q4 FY25 YoY):
IBC (Intermediate Bulk Containers): +44%.
MS (Mild Steel) Drums: +35%.
Polymer (HDPE) Drums: +11%.
10.3 Strategic Expansion & New Initiatives
Wada Plant (Unit 8 - Maharashtra):
Status: Phase 1 complete. Marks significant geographical diversification outside Gujarat.
Timeline: Commercial operations to begin sequentially: Polymer drums (May'25), IBC (June'25), MS Drums (July'25).
Financial Impact: Potential revenue of ~₹200 Cr from Phase 1.
FY26 revenue target from Wada is ₹70-100 Cr (at ~30-35% utilization).
Full potential >₹400 Cr in 3-4 years.
Recycling Plant (Unit 9):
Timeline: Set to begin operations from July-August 2025. Capex: ₹8-10 Cr.
Capacity: Recycle 5,000 MT of plastic annually. Fully automatic plant to reprocess material from customers.
Financial Impact: Expected to generate ₹2-3 Cr in earnings, make EPR liability "nil" over time, and reduce raw material cost by "at least Rs. 10 per kilo."
MS Drum Automation (Unit 6):
Status: Nearing 90% completion. Will double production.
Financial Impact: Will improve margins in this segment from 5-6% to 8-9% starting FY26. Provides a saving of ₹100 per drum.
Capacity Expansion Projections (FY26):
IBC: +29% (to 540,000 units).
Polymer Drums: +20%.
MS Drums: +55%.
10.4 Cost Structure & Margin Improvement Levers
Cost Pressures (FY25): Margins impacted by fluctuating raw material prices (passed on with a lag) and one-time capex/EPR costs booked in Q4.
Margin Improvement Strategy (Path to 11-12% EBITDA Margin):
A 15.25 MW captive solar power plant (operations from Jul'25) is expected to reduce power costs by ₹12-15 Cr annually (higher than initial ₹10 Cr estimate). Payback period of 3 years.
Benefits from the in-house recycling plant (saving ₹10/kg). Increased automation (especially MS Drums) and operating leverage from new capacities will reduce labor/other costs.
Higher contribution from high-margin IBCs.
10.5 Management Outlook & Guidance (FY26 & Beyond)
Guidance (FY26):
Topline Growth: 15% - 20%.
EBITDA Margin: Improvement to upward of 10%. The long-term goal is to return to historical levels of 12-13%.
Gross Profit Margin: Projected to improve to 16.5-17%.
Absolute EBITDA: Above 70 crores.
Depreciation Outlook:₹9.5–10 Cr (₹1.5–2 Cr increase due to capex capitalization).
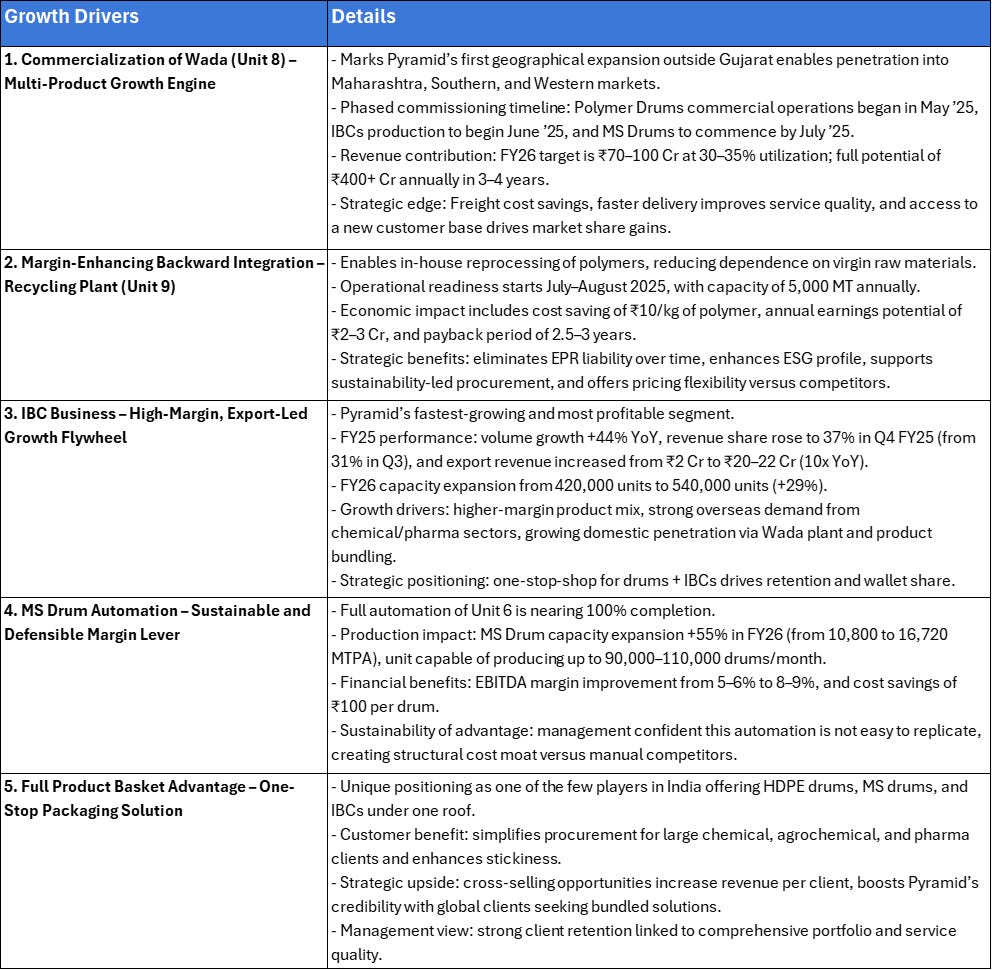
11. Growth Drivers
12. Competitors in the Market:
1. Time Technoplast Ltd.
Time Technoplast is India’s largest player in industrial packaging and a direct competitor to Pyramid. It offers a wide range of polymer-based products including HDPE drums, IBCs, composite cylinders, and multilayer fuel tanks. With a strong presence in over 10 countries, it serves sectors like chemicals, lubricants, agrochemicals, and infrastructure.
2. TPL Plastech Ltd.

A subsidiary of Time Technoplast, TPL Plastech is focused on blow-molded plastic containers such as polymer drums and IBCs. It caters primarily to the chemical, agrochemical, and specialty chemical industries in India. TPL is known for its strong customer relationships and quality standards in polymer packaging.
3. Balmer Lawrie & Co. Ltd.
A public sector enterprise under the Ministry of Petroleum & Natural Gas, Balmer Lawrie is a major steel drum manufacturer in India. It provides packaging solutions to oil, lubricant, and chemical companies, along with services in logistics and travel. Its strong legacy and government backing give it a firm foothold in steel-based industrial packaging.
Thank You So Much For Reading!!
Researched By- Naresh, Mayank and Vaibhav
All information is sourced from the company's annual reports, Press Release, News Articles, GoIndiastocks.in, Screener.in, industry reports, and Economy Outlook reports.
Disclaimer: We do not recommend buying or selling any stock. You should consult your financial advisor before buying or selling any financial instrument.
We are Proud to Announce Our New Launch of the Premium services where we Deep-dive into the Business and back you up with Robust Research.
We Provide services for different Level of Investors. You can Email us directly to start your journey!

If you like the hard work we put in, you can invest in us:
For our Non-Indian audience: You can donate to us through PayPal. Click here.
For our Indian audience, UPI QRs are given below: