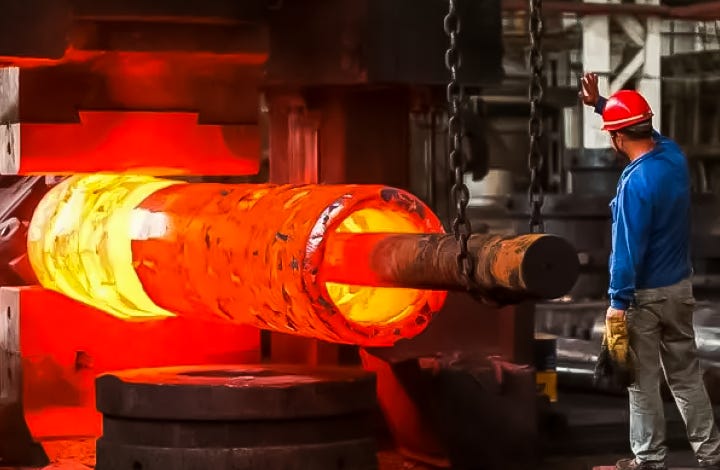
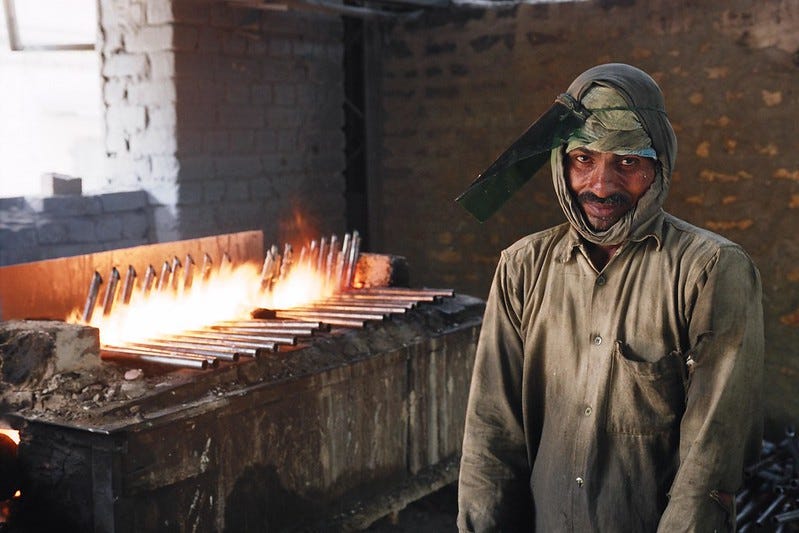
Industry Report: Forging Industry
India Is Growing Faster Than The Global Players?!

Here, at EquityEdge Research, we deep dive into complex Articles and Reports and make it easier for you by presenting everything, RIGHT HERE!!
So, Subscribe so that you do not miss any Upcoming Articles or Reports…
What we will Discuss Today?
Global Forging Industry Overview.
Indian Forging Industry Overview.
Industry Segmentation.
Major Players in India by Production Capacity.
Growth Drivers.
Risks & Challenges.
Industry Outlook.
1. Global Forging Industry Overview:
1.1 Market Growth and Forecasts:
Global Market Valuation & Growth
The forging market was valued at approximately USD 93.87 billion in 2024 and is forecasted to reach around USD 147.32 billion by 2033.
This growth translates to a compound annual growth rate (CAGR) of approximately 5.2%–6.8% over the forecast period .
Industrial Demand:
Automotive: As the temperature for electric vehicles rises, manufacturers need lighter yet highly durable forged components—think of forged engine blocks and transmission parts that reduce overall weight while offering enhanced strength.
Aerospace: Forged components are critical in aerospace due to their superior mechanical properties. For instance, critical landing gear and engine parts benefit from the uniform grain structure produced via forging.
Technological Advancements:
The integration of robotics, automation, and computer-simulated forging processes is boosting efficiency. Companies employing advanced simulation software can optimize heat treatment processes and material flows in real time.
Example: Some manufacturers now use predictive analytics to reduce waste and ensure that the final forged products meet strict quality standards.
1.2 Regional Insights:
The forging industry landscape varies significantly across regions:
Asia-Pacific: This region dominates the global market, commanding nearly 50% of the volume. Rapid industrialization, expanding automotive sectors, and large-scale infrastructure projects—especially in emerging economies like China and India—drive robust growth in this region.
Europe: With an estimated 25% market share, Europe is a hub for high-quality manufacturing. Stringent quality and environmental standards, coupled with strong automotive and aerospace sectors, foster innovation and premium product offerings.
North America: The U.S. and Canada account for roughly 20% of the market. The region benefits from steady demand from automotive, aerospace, and defense sectors, with investments in advanced and sustainable forging processes.
Other Regions: Emerging markets in the Middle East and Latin America are gradually contributing to sector growth as industrialization and modernization progress .
1.3 Major Players:

2. Indian Forging Industry:
2.1 Introduction
Installed capacity: 4.7 million tonnes
Production in FY2024: 2.35 million tonnes
Annual industry contribution to GDP: ₹45,000 crore
Key end-user segments:
Automotive: 65% of total production
Aerospace: 18%
Construction: 12%
Looking ahead, the market is expected to grow from USD 7.7 billion in 2025 to USD 12.8 billion by 2032, at a CAGR of 7.4%.
This growth is driven by rising exports, use of lightweight materials, and strong demand from sectors like aerospace and construction.
MSME Dominance: Over 83% of the 4,000+ forging units are micro and small enterprises.
Geographic hubs: Tamil Nadu, Punjab, and Maharashtra
Energy challenge: Traditional forging uses 3.8 kWh/kg of energy, prompting ₹2,200 crore investment in energy efficiency upgrades.
2.2 Key Trends
2.2.1 Production & Capacity Utilization (FY2024)
Current capacity utilization stands at 58%, mainly due to sluggish demand in the auto sector and raw material supply issues.
Production has bounced back to 2.8 million tonnes, recovering from COVID lows but still slightly below the 3.0 million tonnes peak seen in FY2019.
Export share: 19% of the total market
Crankshafts: 32%
Connecting rods: 24%
Transmission components: 18%
2.2.2 MSME Dominance and Cluster Dynamics
The Indian forging industry is largely MSME-driven, with over 83% of units being small or micro enterprises. Regional specialization plays a major role in how the market operates:
Punjab Cluster (23% share):
Specializes in agricultural equipment and tractor components.Tamil Nadu (40% share):
Supplies automotive OEMs like Hyundai and Renault-Nissan, focusing on engine forgings.Maharashtra:
Known for aerospace-grade titanium forgings, supplying to ISRO and HAL.
2.2.3 Export Competitiveness
India's forging exports rose 22% YoY to USD 3.1 billion in FY2024, driven by strong cost and quality advantages:
27% cost advantage over European producers
68% of exporters are IATF 16949 certified
Strong global tie-ups, including:
Tesla – aluminum subframes
Airbus – landing gear components
2.3 Technological Advancements and Material Innovation
Lightweight Material Adoption
Automotive OEMs are increasingly turning to lightweight materials like aluminum to reduce vehicle weight and improve efficiency.
Key savings:
Aluminum engine blocks: 12 kg lighter than cast iron
Hollow axle shafts: 9 kg lighter per vehicle
Market impact:
Non-ferrous forgings' share grew from 14% in 2020 to 23% in 2024
Projected to reach 38% by 2030
2.4 Energy Efficiency and Sustainability Challenges
Energy Consumption Patterns
The forging sector consumes over 8.2 million tonnes of oil equivalent (TOE) annually, with the following energy mix:
Natural Gas (48%) – Primarily used in reheating furnaces
Electricity (33%) – Powers presses and support systems
Coal (19%) – Still used in older MSME units
2.5 Raw Material Supply Chain Dynamics
2.5.1 Steel Price Volatility Management
In 2024, forging-grade steel prices (EN8, EN19) fluctuated by 18%, pushing players to adopt multiple risk mitigation strategies:
34% of organized players have vertically integrated by acquiring scrap processing units
6-month price-lock contracts have become common in contract forging deals
Secondary steel usage has increased to 41% in MSME clusters, lowering cost dependencies
2.5.2 Aluminum Supply Security
With 62% of aluminum requirements still imported, securing a reliable and cost-effective supply has become a top priority:
PLI scheme support has encouraged initiatives like the Vedanta–Bharat Forge JV for local aerospace-grade billet production
18% import duty reductions on primary aluminum have been granted to support exporters
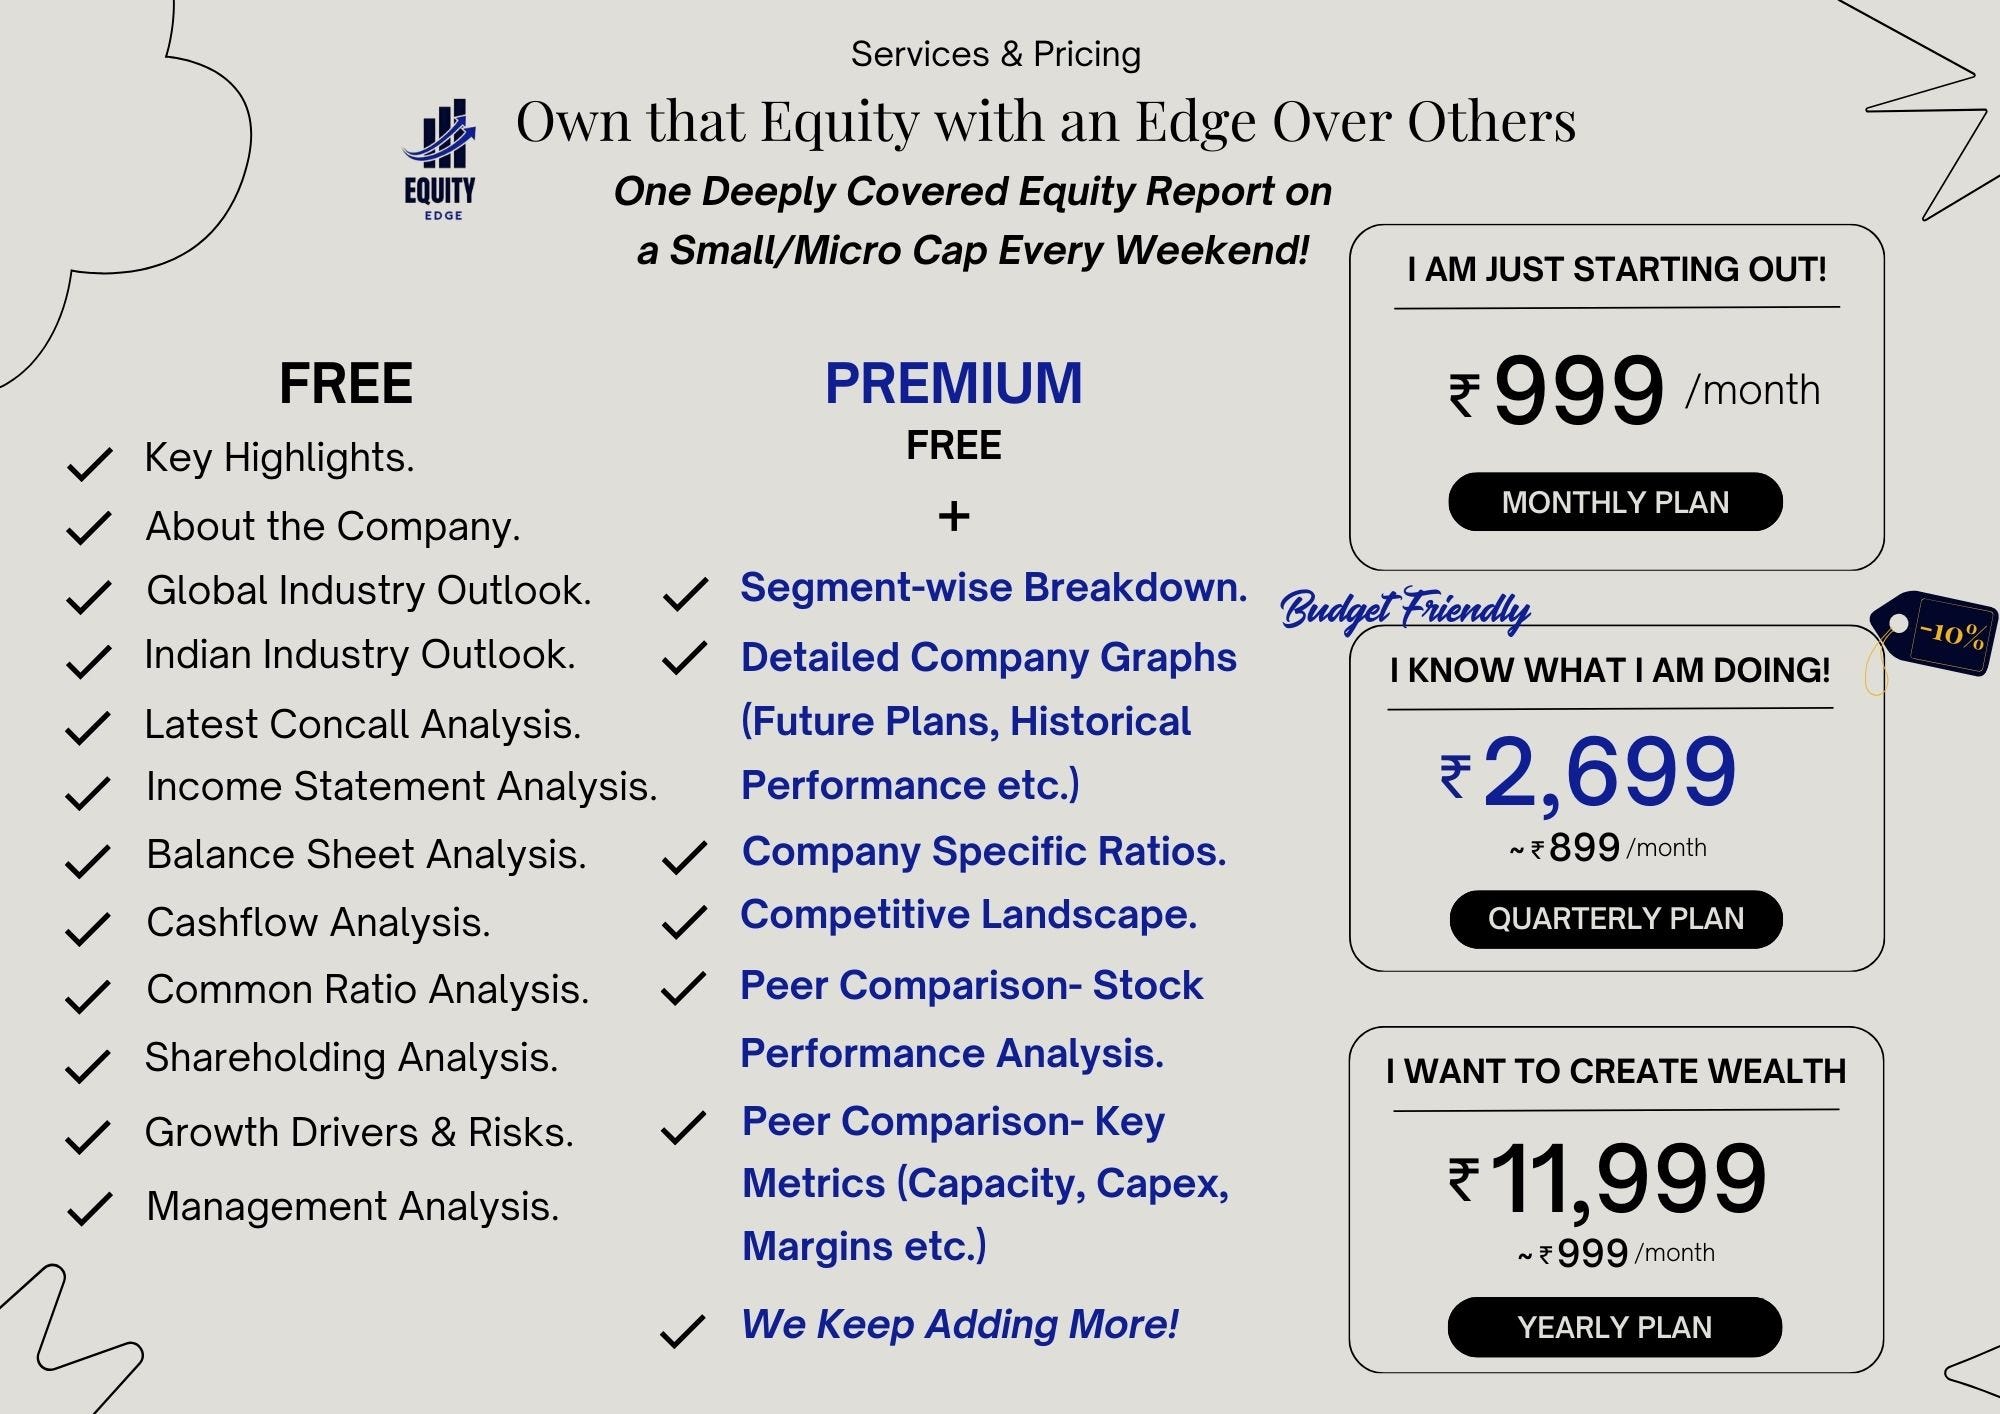
We are Proud to Announce Our New Launch of the Premium services where we Deep-dive into the Business and back you up with Robust Research.
We Provide services for different Level of Investors. You can Email us directly to start your journey!
3. Industry Segmentation:
3.1 By Technique
Closed Die Forging (Impression Die): Involves compressing metal between two shaped dies, creating high-precision parts. Common in automotive and aerospace industries.
Example: Bharat Forge – Crankshafts, connecting rods.Open Die Forging: Metal is deformed between flat or simple dies, not fully enclosed. Used for large, heavy components like shafts or blocks.
Example: L&T Special Forgings – Industrial shafts, marine parts.Rolled Ring Forging: A ring is formed and rolled from a pierced metal piece, known for strength and durability in high-stress environments.
Example: NTB (Germany) – Bearing and turbine rings.
3.2 By End-Use Industry
Automotive: Supplies parts like axles, gear blanks, and crankshafts for cars, trucks, and tractors.
Example: Bharat Forge, Sundaram Clayton.Aerospace: High-strength, lightweight components like turbine disks and landing gear parts.
Example: Precision Castparts Corp (USA).Oil & Gas: Flanges, valves, and pressure vessel parts for extreme conditions.
Example: Ramkrishna Forgings – Wellhead components.Industrial Machinery: Heavy equipment parts such as press components, hooks, and couplings.
Example: Thyssenkrupp AG (Germany).
3.3 By Material
Carbon & Alloy Steel: Most common due to strength and versatility; used across automotive and industrial applications.
Example: Nippon Steel Corp (Japan).Aluminum: Lightweight, corrosion-resistant; widely used in aerospace and EV sectors.
Example: Arconic (USA).Titanium & Nickel Alloys: High-performance materials for aerospace, defense, and nuclear sectors.
Example: VSMPO-AVISMA (Russia).
3.4 By Geography
India: Emerging hub for auto and industrial forgings; cost-effective and export-oriented.
Example: Bharat Forge, Ramkrishna Forgings.USA: Focused on aerospace and defense-grade forgings with high standards.
Example: Precision Castparts Corp.Germany & Japan: Advanced capabilities in precision and industrial forgings.
Example: Thyssenkrupp (Germany), Nippon Steel (Japan).
4. Major Players in India by Production Capacity:
1. Bharat Forge Limited
Forging Capacity: Over 600,000 metric tonnes per year, including 50,000 metric tonnes for aluminium forging and 77,760 metric tonnes for iron casting on a consolidated basis.
Industry Focus: Automotive, aerospace, defense, oil & gas, and railways.
Key Strengths: Advanced forging technology, global presence, and high-performance components.
Recent Developments:
Secured new orders worth ₹830 crores across various business verticals in Q3FY25.
Announced a partnership with Liebherr-Aerospace & Transportation SAS to establish a high-tech manufacturing facility in India, featuring a ring mill for advanced forging and machining.
2. Ramkrishna Forgings Limited
Forging Capacity: Total production capacity increased to 243,400 metric tonnes per annum for hot and warm forgings, and 25,000 metric tonnes per annum for cold forgings.
Industry Focus: Railways, automotive, mining, construction, and general engineering.
Key Strengths: Wide range of forged products, strong export presence in 23 countries.
Recent Developments:
Expanded production capacity by 14,250 metric tonnes per annum through the addition of new machinery.
Plans to double steel casting capacity to 120,000 tonnes per year by 2025.
3. CIE Automotive India Limited
Forging Capacity: Estimated at 150,000+ metric tonnes per year.
Industry Focus: Automotive sector, including passenger and commercial vehicles.
Key Strengths: Expertise in hot and warm forging technologies.
Recent Developments:
Expanded installed capacity of forgings by 1,773 metric tonnes to 42,765 metric tonnes in 2006-07.
Continued to advance towards the ambitious commitments set down in their 2025 Strategic Plan.
4. Happy Forgings Limited
Forging Capacity: 120,000 metric tonnes per year.
Machining Capacity: 51,000 metric tonnes per year.
Industry Focus: Automotive, industrial machinery, power generation, railways, and wind turbines.
Key Strengths: Leading exporter of forged components with a strong international presence.
Recent Developments:
Invested ₹650 crore to establish a new manufacturing unit for heavy-duty forged components weighing up to 3,000 kilograms.
Secured long-term supply deals for heavy industrial components, enhancing its position in the global market.
5. MM Forgings Limited
Forging Capacity: Estimated at 100,000+ metric tonnes per year.
Industry Focus: Automotive, industrial machinery, and power generation.
Key Strengths: Leading exporter of forged components with a strong international presence.
Recent Developments:
Reported a standalone revenue of ₹1,143.35 crore for YTD Dec 2024, with a profit after tax of ₹100.07 crore.
Focused on launching new products to take advantage of the forging capacities created in recent years.
5. Growth Drivers:
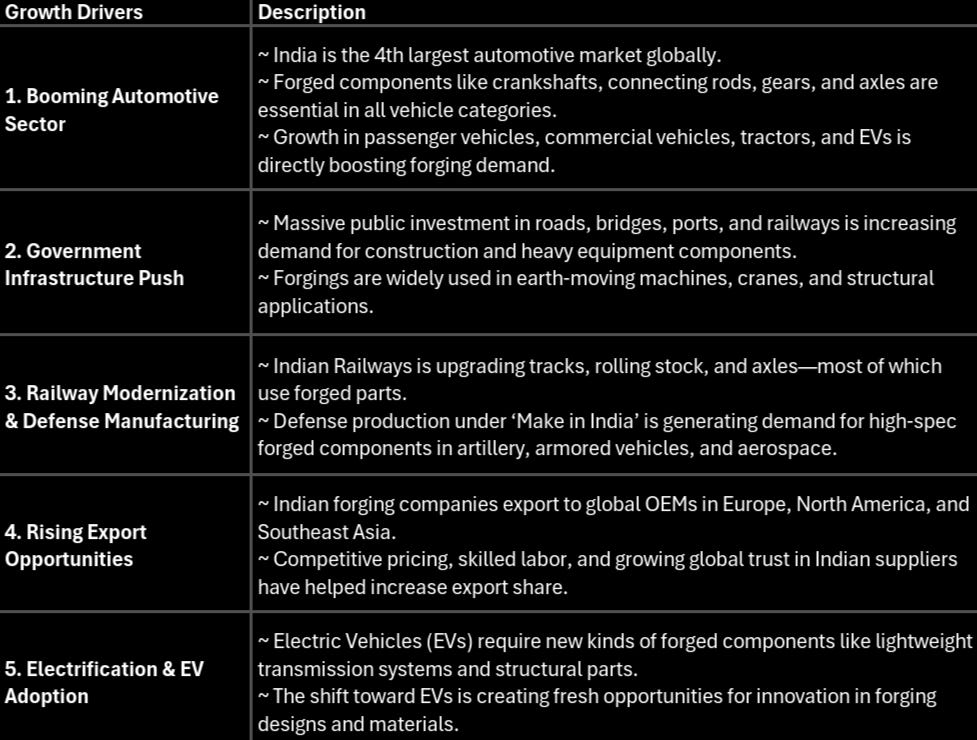
6. Risks & Challenges:
1. Raw Material Price Volatility
Steel forms 60–70% of input cost; EN-series steel saw 18% YoY price swings in 2024.
Imported billet prices jumped 27% in Q1 2025 post Russia-Ukraine conflict.
62% of aerospace-grade aluminum is imported, exposed to USD volatility and China's quota restrictions.
2. High Dependence on Auto Sector
Automotive accounts for 65% of forging demand—OEM cuts cause ripple effects.
FY24 passenger vehicle production fell 22%, forcing 34% of MSMEs into partial shutdowns.
EV shift threatens legacy product lines—ICE parts form 58% of auto forging revenue, while EV components show slower growth.
3. Energy and Environmental Compliance Pressure
Specific energy use (3.8 kWh/kg) is 22% above global standards; energy costs ₹18–22/kg in India vs ₹12–14/kg in Japan.
₹2,200 crore investment needed to meet BEE's 15% energy cut target by 2027.
New CPCB norms require ion-exchange wastewater systems costing ₹4.2–5.8 crore/unit; non-compliance risks ₹10 lakh/day fines.
4. Technological Obsolescence
63% of MSMEs use outdated 1980s machinery—38% higher rejection rates.
Only 12% adoption of CNC forging in Coimbatore cluster; low IIoT penetration (32%) despite 41% downtime reduction potential.
Barriers: ₹2.5 crore capex, skill gaps (53% vacancy in IIoT roles), and lack of cloud infrastructure (68% units).
5. Global Competition and Regulatory Burdens
Chinese dumping rose 62% in 2024; undercut prices by 27%, causing ₹850 crore loss.
Vietnamese firms offer 18% cheaper exports via lower labor and subsidized power.
Regulatory costs: 18% rise in MSME expenses due to pollution and green cover mandates.
7. Industry Outlook:
Outlook of the Forging Industry (2025–2033)
The global and Indian forging industries are positioned for stable and moderately strong growth, driven by rising demand across sectors like automotive, aerospace, and construction, alongside the rapid adoption of lightweight materials and digital forging technologies. Below is a detailed outlook based on your input:
1. Global Market Outlook
Market Size: USD 93.87 billion in 2024, projected to reach USD 147.32 billion by 2033.
CAGR: 5.2%–6.8%
Growth Drivers:
Lightweight material adoption (aluminum, titanium)
EV and aerospace sector expansion
Technological improvements in simulation and automation
Technological Shift: Robotics, predictive analytics, and real-time optimization are reducing waste and improving quality standards.
2. India Market Outlook
Market Size: USD 7.7 billion in 2025, expected to grow to USD 12.8 billion by 2032.
CAGR: 7.4% — outpacing global growth due to export competitiveness and cost advantage.
Installed Capacity: 4.7 million tonnes, with 58% utilization, indicating room for output growth as demand recovers.
Production: 2.8 million tonnes in FY2024; still below pre-COVID peak (3.0 million tonnes in FY2019), but on a recovery trajectory.
3. Sectoral & Regional Dynamics
Automotive: Largest consumer (~65%) but recovering slowly post-COVID; electrification is increasing the demand for aluminum-based forgings.
Aerospace: 18% share and high-margin, with India gaining traction in titanium forgings (ISRO, HAL, Airbus).
Regional Clusters:
Tamil Nadu (40% share) – automotive OEMs
Punjab – agricultural and tractor components
Maharashtra – aerospace components
4. Export & Competitive Edge
FY2024 Exports: USD 3.1 billion, up 22% YoY
Cost Advantage: 27% over European peers
Certifications: 68% IATF 16949 certified – enabling quality-sensitive exports
Global Clients: Airbus, Tesla – increasing India’s strategic relevance
5. Key Trends to Watch
MSME Dominance: 83% of 4,000+ units are MSMEs – resilient but face energy and technology upgrade challenges
Non-ferrous Forgings: Share rose from 14% (2020) to 23% (2024), and expected to hit 38% by 2030
Energy Efficiency: Sector consumes 8.2 million TOE/year. Investment of ₹2,200 crore planned to upgrade to more efficient processes
Raw Material Volatility:
Steel price fluctuations led to integration and hedging practices
Aluminum supply is still import-dependent; PLI and JV initiatives aim to improve this
THANKYOU FOR READING!!
Hope you liked our work, Please Subscribe so that we can reach out to more People like you!
Other Sources Used: Care Ratings, Companies’ official site, Mordor Intellegence, Allied Market Research, Business Market Research, India Infoline, The Machine Maker, Autocar Professional, Capital Market, CIE Automotive, MM Forgings, Tijori Finance, Company filings and News Reports.
We are Proud to Announce Our New Launch of the Premium services where we Deep-dive into the Business and back you up with Robust Research.
We Provide services for different Level of Investors. You can Email us directly to start your journey!
If you like the hard work we put in, you can invest in us:
For our Non-Indian audience: You can donate to us through PayPal. Click here.
For our Indian audience, UPI QRs are given below: