Here at EquityEdge Research, we make Small-Cap Investing easy for you by Backing you up with Robust & Full-Fledged Research.
We Have Launched Our Website. Please check
Please Fill the form Below if you are interested in our Services and would like a Free Sample of our Equity Research Report covering a Small/Micro-cap Company.
Read our Previous Report here:

Table of Contents:
Key Highlights.
Company Price Chart Analysis.
About the Company.
Management Analysis.
Financial Analysis
Ratio Analysis.
Shareholding Analysis.
Concall Analysis.
SWOT Analysis.
Competitors.
Premium (Includes Free):
Global E-Waste Management Industry.
Indian E-Waste Management Industry.
Financial Analysis- Quarterly.
Competitive Analysis- Bio & Financials.
Daily Share price trend TTM- Peer comparison.
Segment Wise Performance.
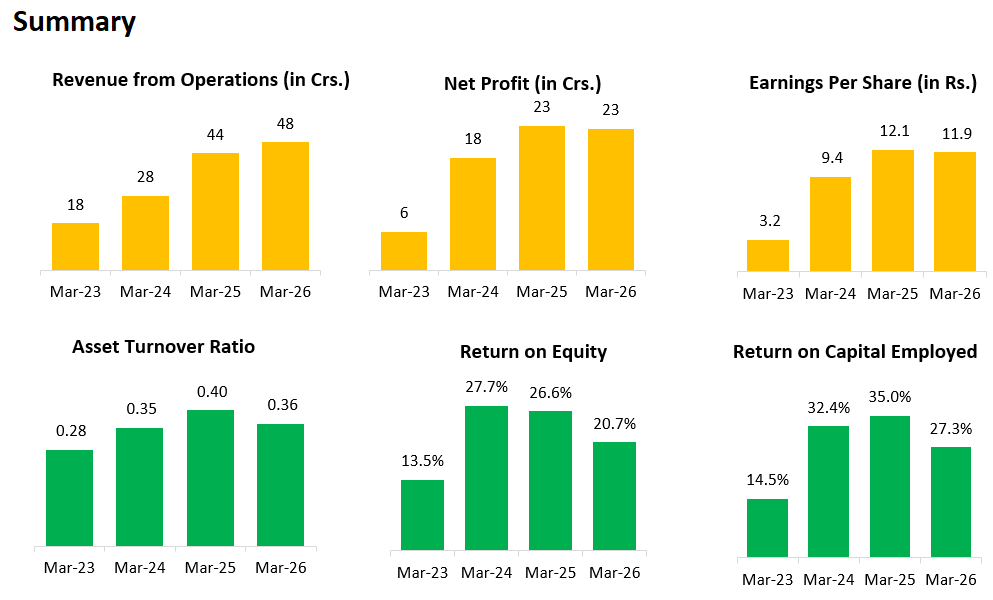
1. Key Highlights:
FY26
REVENUE: ₹ 48 Cr. (+9.09% YoY)
EBITDA: ₹ 29 Cr. (-6.45% YoY)
EBITDA MARGIN: 60% (-1100 bps YoY)
PAT: ₹ 23 Cr. (No Change in YoY)
Q4FY26
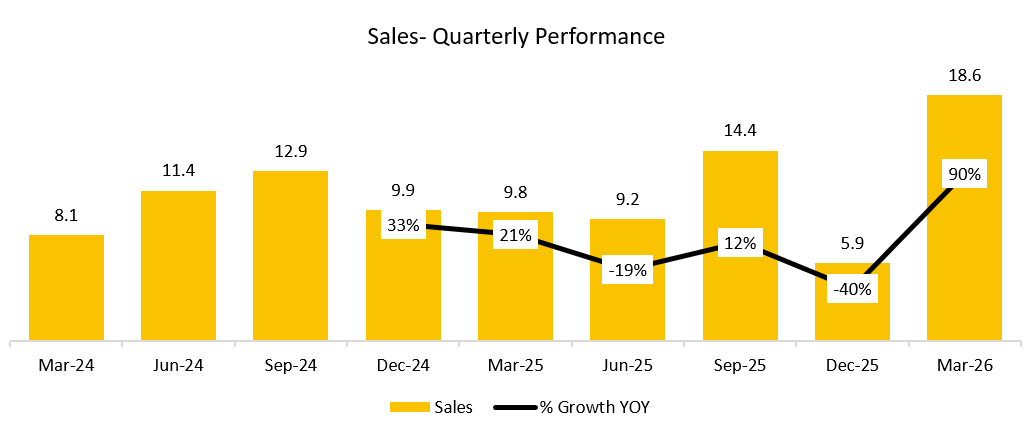
REVENUE: ₹ 18.61 Cr. (+214.89% QoQ, +90.48% YoY)
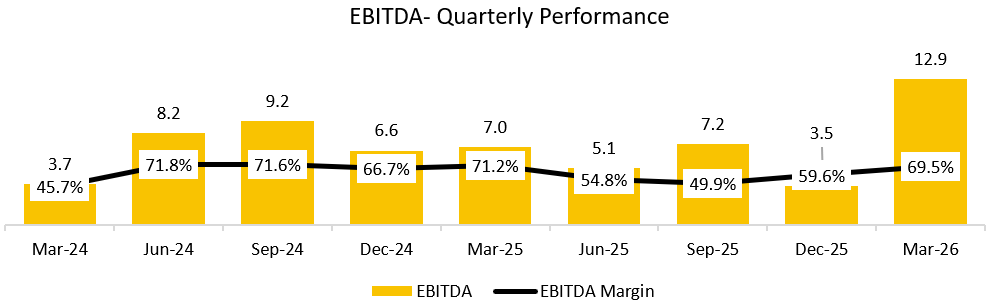
EBITDA: ₹ 12.93 Cr. (+267.33% QoQ, +85.78% YoY)
EBITDA MARGIN: 69.48% (+1004 bps QoQ, -176 in YoY)
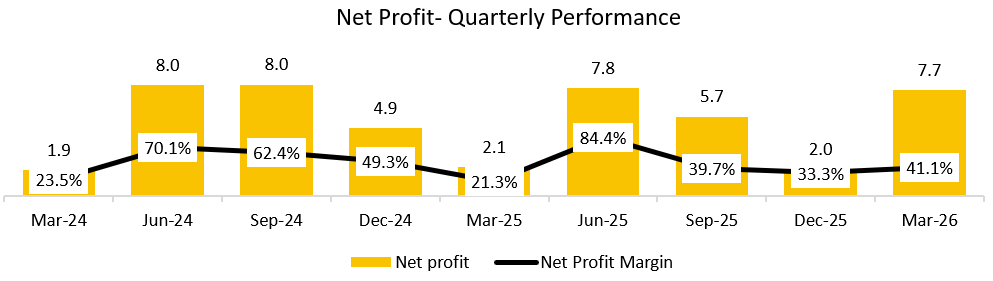
PAT: ₹ 7.14 Cr. (+248.29% QoQ, +224.55% YoY)
OTHER HIGHLIGHTS:
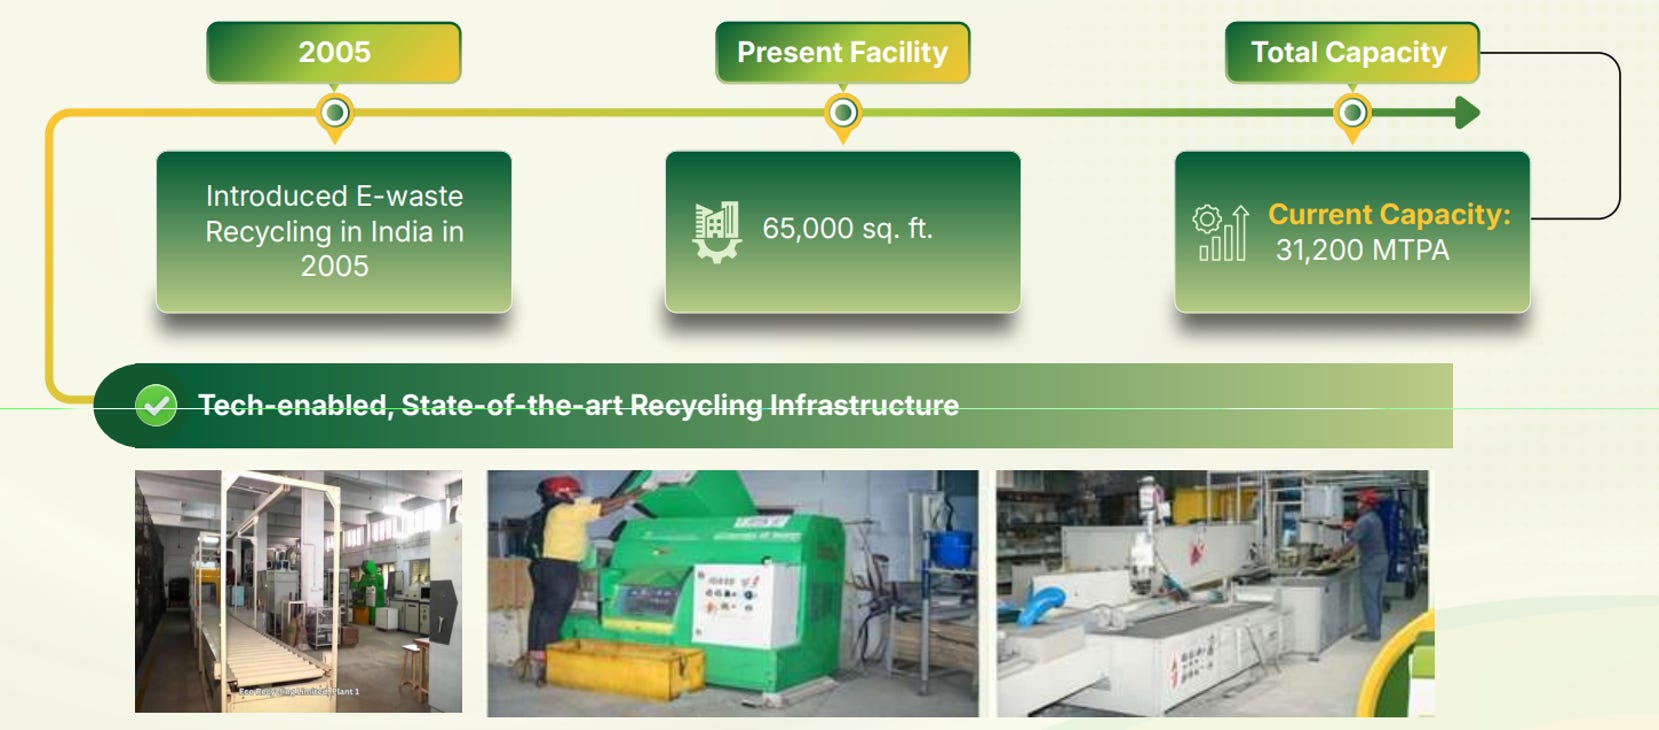
Current Capacity: 31,200 MTPA.
INDIA: 4 largest e-waste generator in the world (7% of global e-waste with recycling rate of 10%).
E-waste generation in India has increased from ~2.76 MMT in 2020 to ~6.19 MMT in 2024 and 14 MMT by 2030.
Present Facility: 65,000 sq. ft.
Already commissioned 6,000 MTPA capacity for Black Mass production.45,000+ Tonnes E-Waste Recycled | 500 + Clients Served.
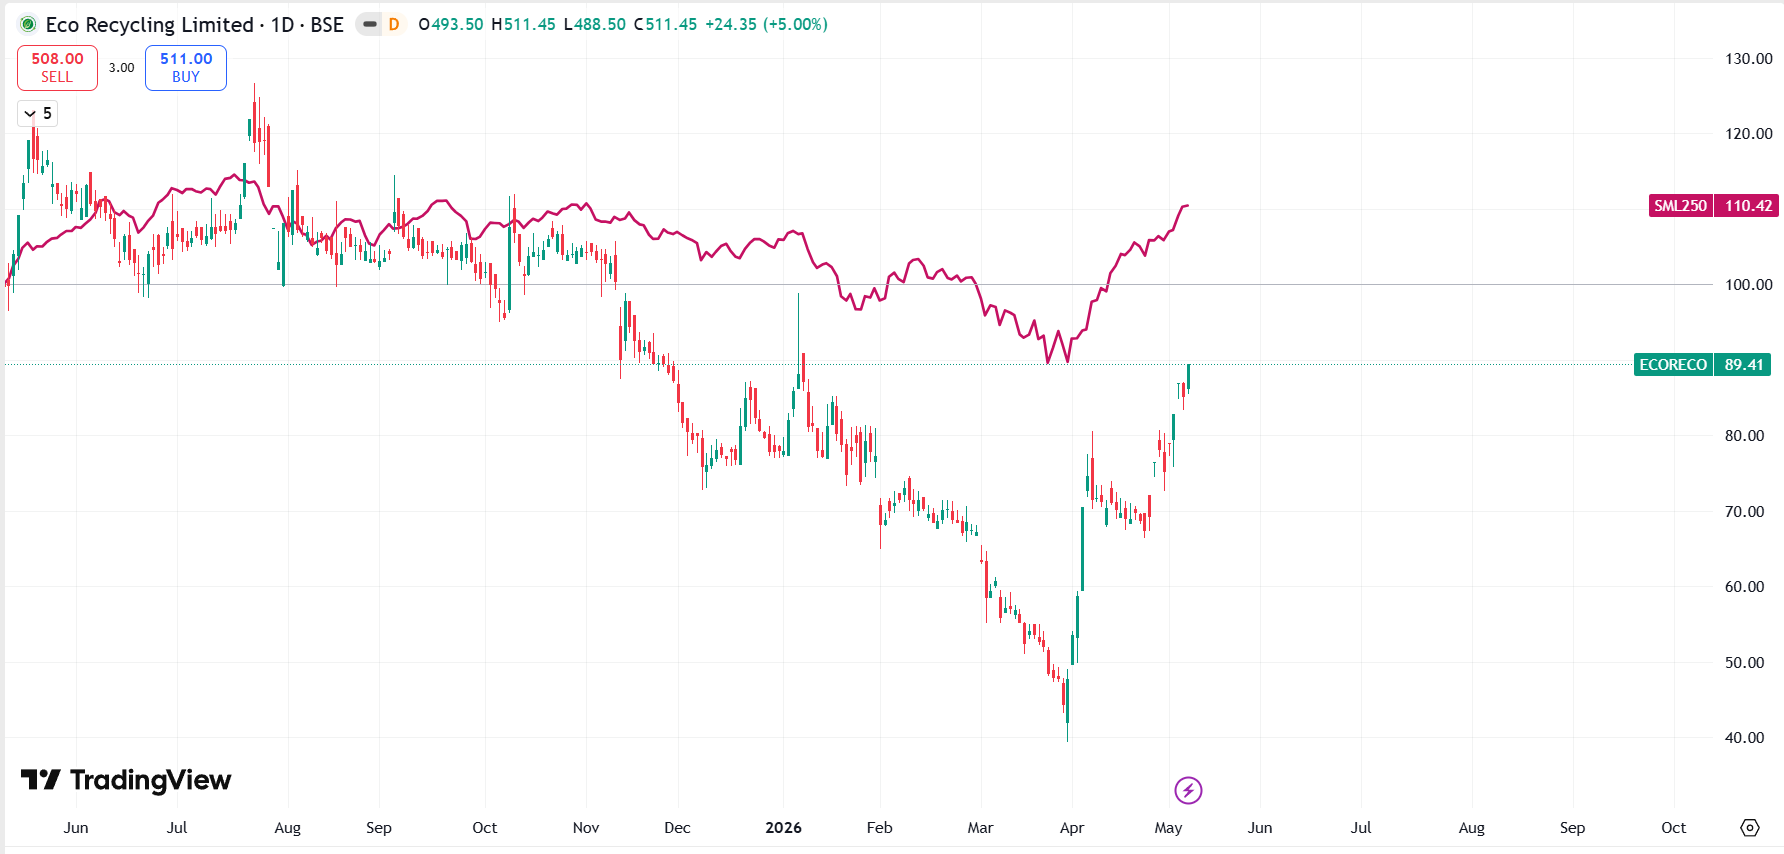
2. Company Price Chart Analysis:
*Comparison charts are Indexed*
2.1 Eco Recycling Ltd. Performance:
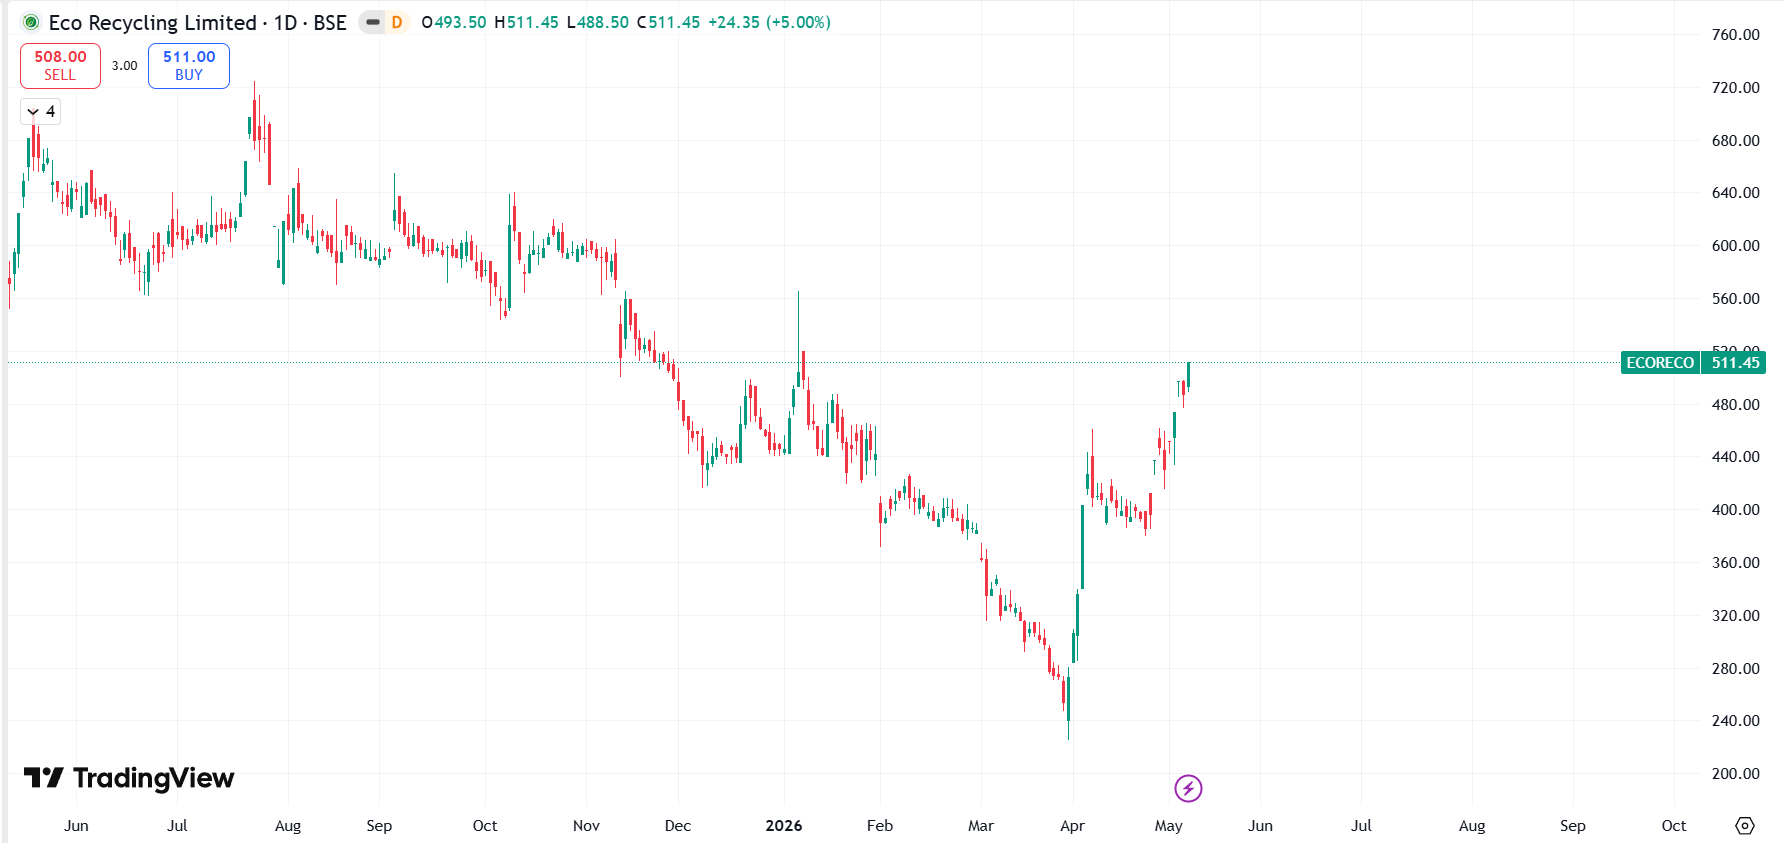
2.2 Eco Recycling Ltd. Vs. SENSEX:
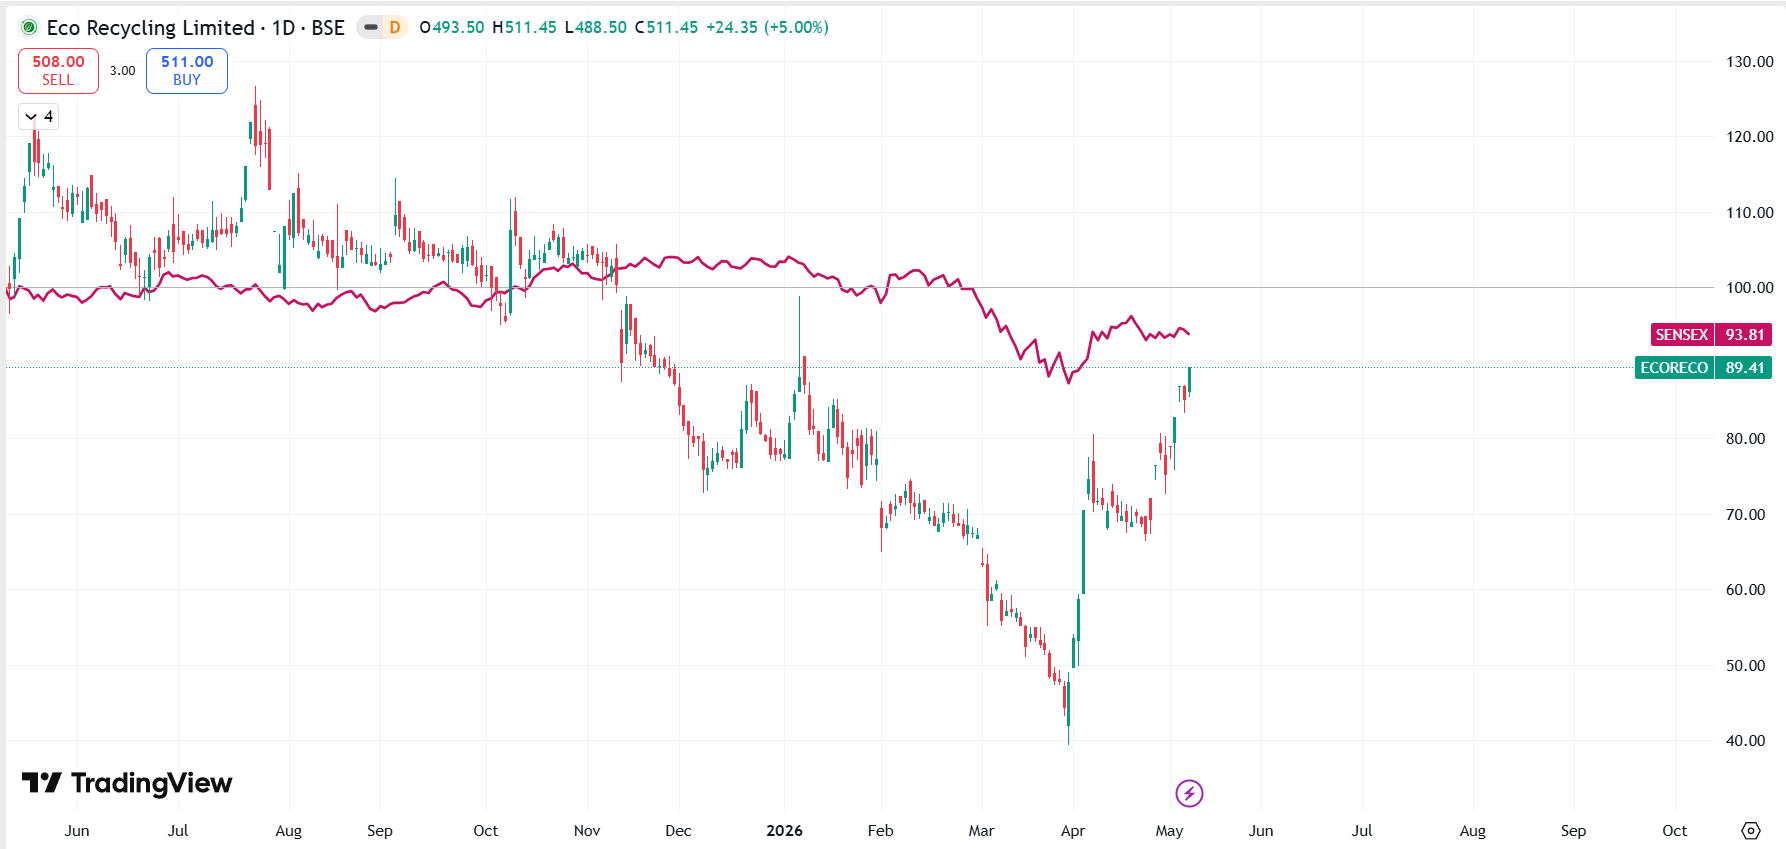
2.3 Eco Recycling Ltd. Vs. SML250:
3. About Company:
Eco Recycling Ltd. (Ecoreco) is an Indian company engaged in the recycling and management of electronic waste (e-waste). The company provides environmentally compliant solutions for the collection, dismantling, recycling, and disposal of discarded electrical and electronic equipment.
Its operations support sustainable waste management practices by recovering valuable materials from electronic waste while ensuring safe disposal of hazardous substances. The company caters to corporates, government organizations, manufacturers, and bulk consumers, helping them comply with India’s e-waste management regulations.
3.1 BUSINESS SEGMENTS:
1. E-Waste Recycling & Asset Management:
This is the core segment of the company and includes the collection, segregation, dismantling, and recycling of electronic waste such as computers, servers, mobile devices, telecom equipment, and consumer electronics.
The company recovers reusable and valuable materials including metals, plastics, and components, while safely handling hazardous waste generated during the recycling process. This segment also includes IT asset disposition (ITAD) services, where obsolete electronic assets are securely disposed of or refurbished.
2. Refurbishment & Reuse Services:
Under this segment, the company undertakes the refurbishment and resale of reusable electronic equipment and components. Devices that are still functional are repaired, upgraded, or refurbished for reuse, helping extend product life cycles and reduce electronic waste generation.
This segment supports the concept of a circular economy by promoting reuse instead of disposal.
3. Data Destruction & Compliance Services:
This segment includes secure data destruction, compliance management, and environmental reporting services provided to clients disposing of electronic assets. The company ensures that sensitive information stored in devices is permanently destroyed before recycling or disposal.
These services help organizations comply with data security and environmental regulations.
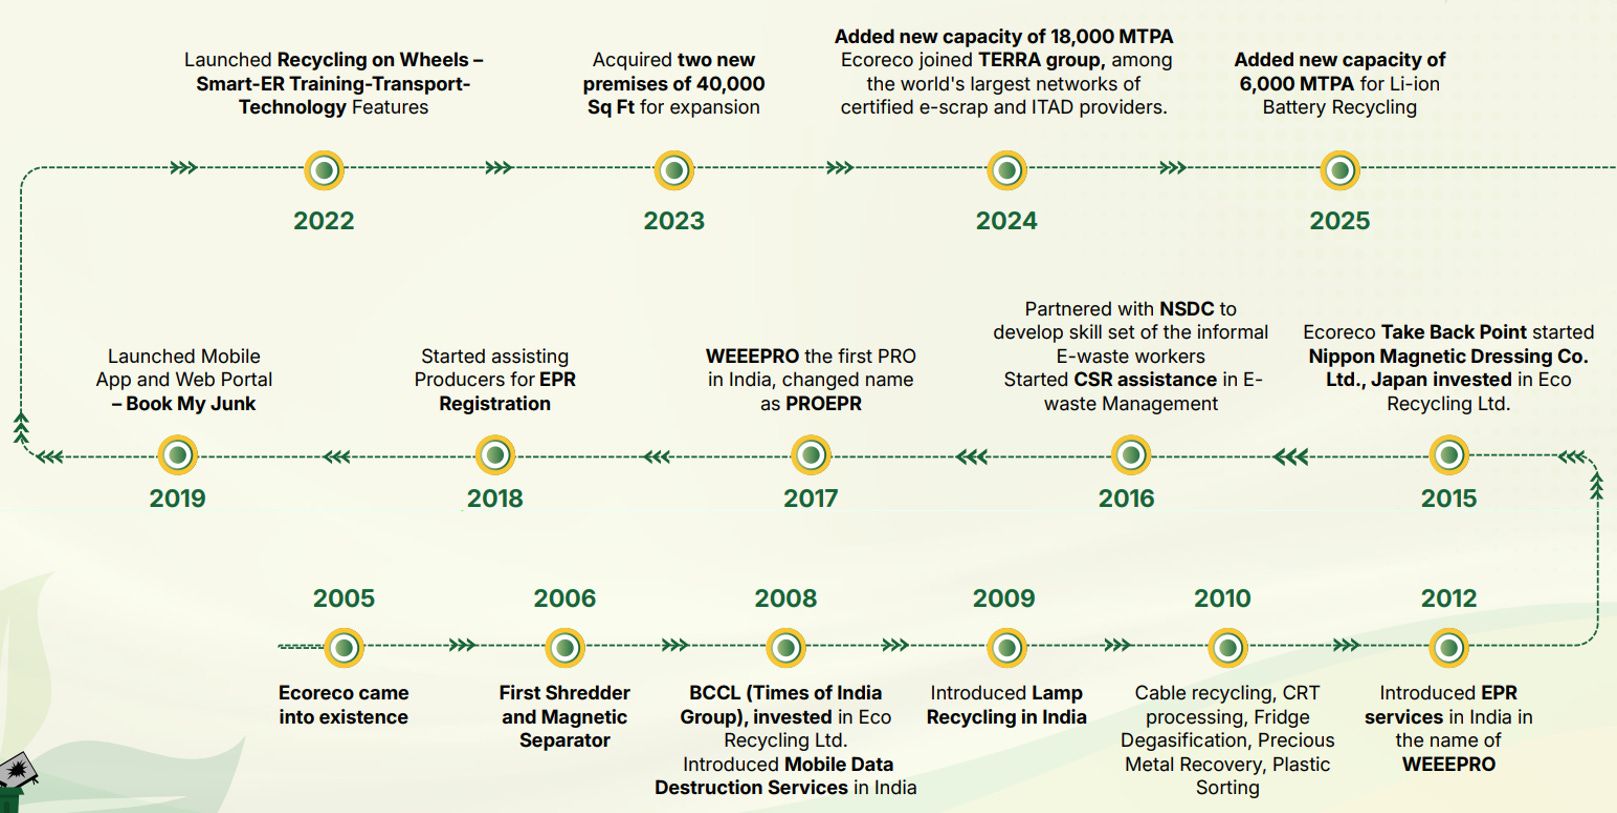
3.2 Company Journey
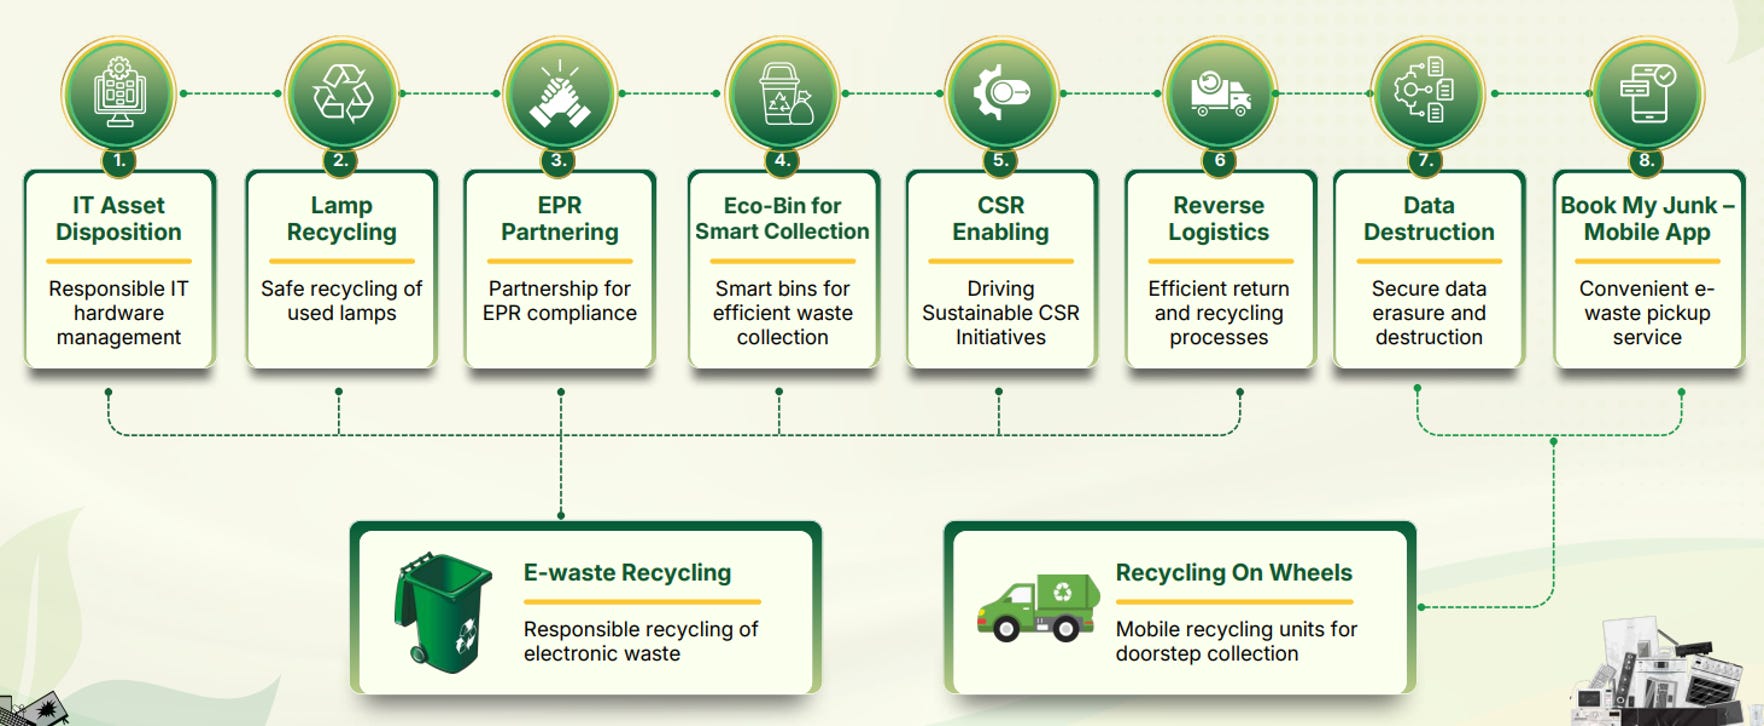
3.3 Company 360 Circular Portfolio
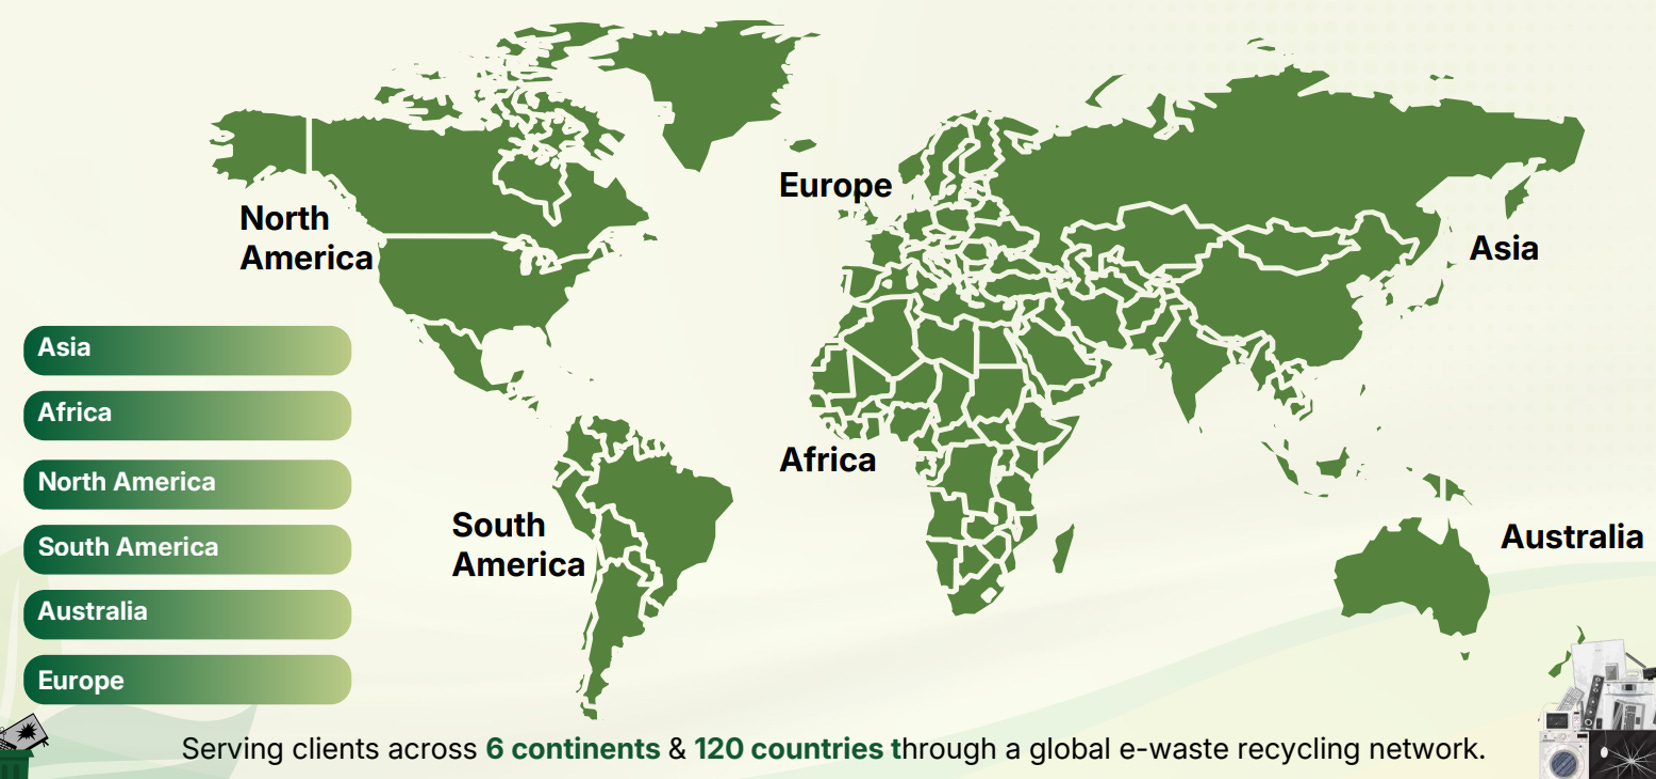
3.4 Geographical Presence
3.5 Mumbai Facility: High-capacity, Tech-enabled Recycling Infrastructure
4. Management Overview:
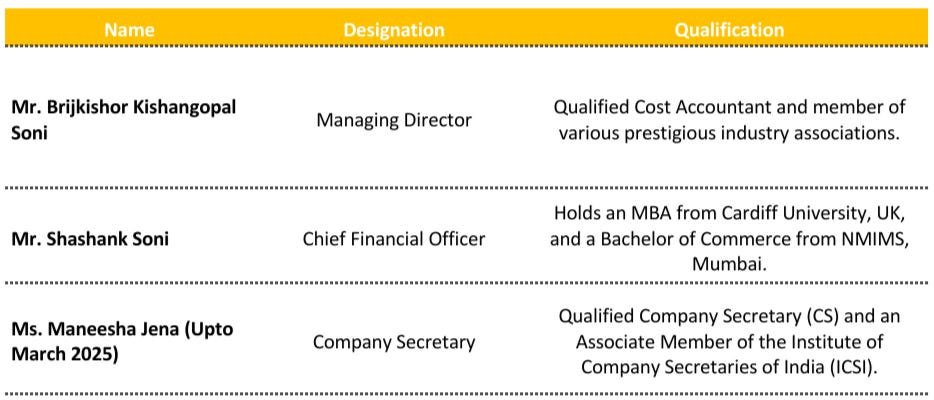
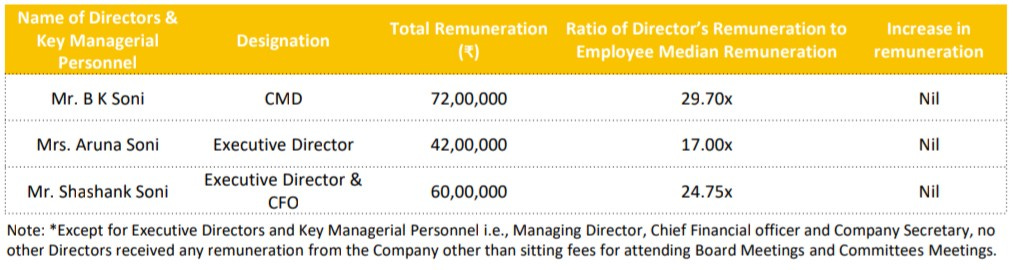
4.1 KMP’s Remuneration:
5. Company’s Financial Analysis:
5.1 QUARTERLY ANALYSIS:
(Read detailed Quarterly Analysis in the Premium Version)
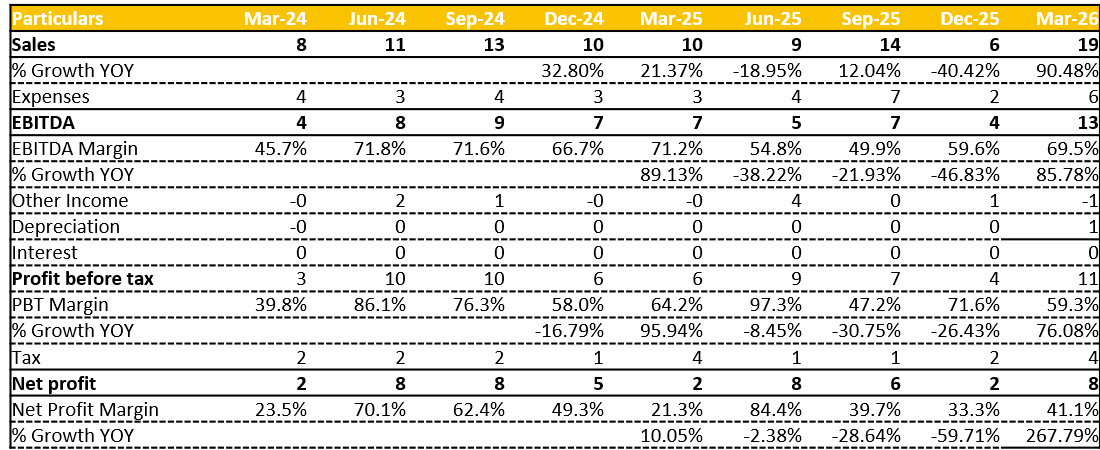
Growing at a CQGR of 11% in last 9 Quarters.
Growing at a CQGR of 17% in last 9 Quarters
Growing at a CQGR of 19.1% in last 9 Quarters.
5.2 ANNUAL ANALYSIS:
(Read detailed Annual Analysis and Forecasts in the Premium Version)
5.2.1 Revenue:
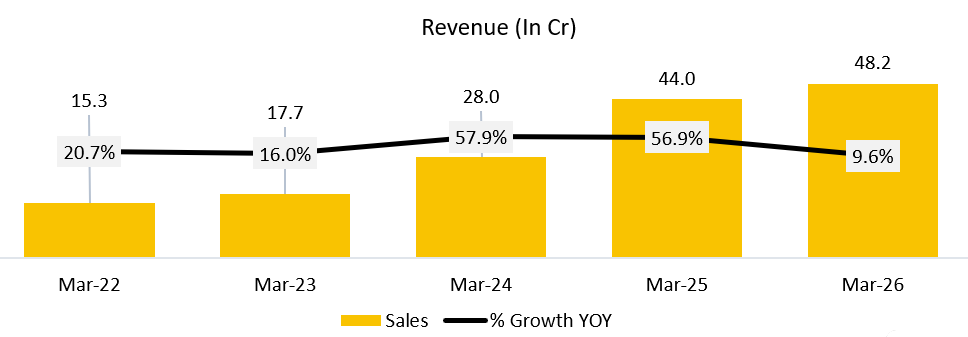
4Y CAGR: 25.8%
FY24 Jump (+57.9%): FY24 growth was driven by the formal launch of the CPCB (Central Pollution Control Board) EPR (Extended Producer Responsibility) portal, which created a digitized, documented mechanism for credit transfer to producers. Ecoreco was well positioned as it had been preparing for commercial EPR services since 2012. This opened a new revenue stream on top of core recycling, pulling in producers who now had a formal obligation to comply.
FY25 Jump (+56.9%): Two engines fired together. First, EPR adoption widened as companies on the fence started joining, fearing environmental compensation penalties. Second, Ecoreco commanded premium pricing from MNC (Multinational Corporation) clients who needed full compliance, not just formality. Management confirmed ₹1.5 cr of EPR revenue in Q4 FY25 alone, with Q1 FY26 already tracking higher. The company also runs a high value mix strategy, IT (Information Technology) and communication devices over white goods, which expanded margins significantly (EBITDA (Earnings Before Interest, Tax, Depreciation and Amortisation) hit 70.7%).
FY26 Almost Flat (+9.6%): A Confluence of Headwinds This is where it gets interesting. Three factors converged:
First, a fire on January 15, 2024 disrupted operations for nearly a month in Q4 FY25, which bled into FY26 momentum. Management confirmed this directly when questioned about the Q4 revenue dip.
Second, the CPCB EPR portal was shut down from March 19 to April 20, 2024, meaning EPR credits could not be transferred to producers for over a month. This compressed Q4 FY25 EPR revenue and delayed the ramp into FY26.
Third, and structurally more important, the new 18,000 MT (Metric Tonne) facility in Vasai was only inaugurated on June 5, 2024. It saw negligible utilization in Q1 FY26. Combined with the existing facility running at roughly 60% of 7,200 MT, overall throughput growth was limited.
5.2.2 Gross Profit
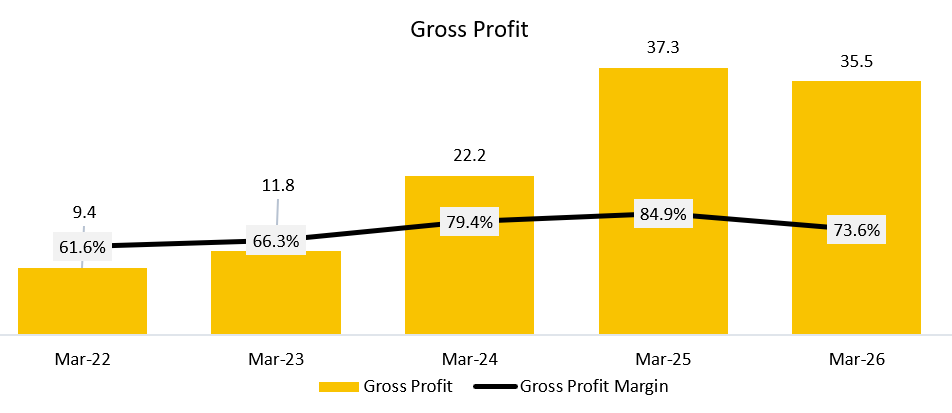
4Y CAGR: 30.4%
GP margin expanded consistently from 61.6% in FY22 to a peak of 84.9% in FY25, then pulled back to 73.6% in FY26. The expansion through FY24 and FY25 was driven by Ecoreco’s strategy of acquiring e-waste from MNC (Multinational Corporation) clients at nominal or zero cost, essentially getting producers to bear collection and logistics expenses as part of their EPR (Extended Producer Responsibility) obligation. This is a structural advantage the company has built deliberately, by investing in high end compliance infrastructure that MNCs in developed countries recognise and are willing to pay for. As BK Soni put it on the Q4 FY25 call, these clients pay not just to meet a formality, but because it is a real compliance obligation for them globally.
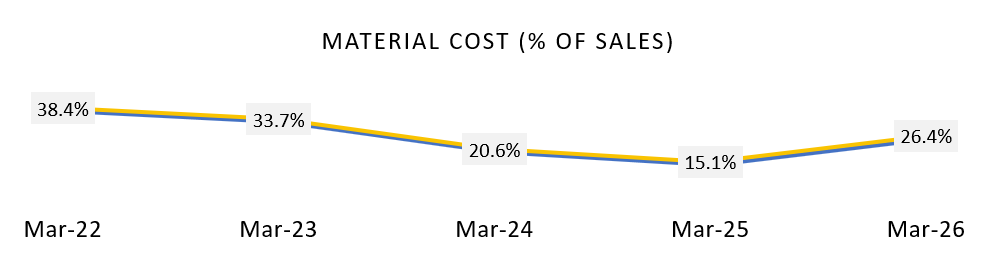
The FY26 reversal was squarely a material cost problem. Material cost as a percentage of sales nearly doubled from 15.1% in FY25 to 26.4% in FY26, and in absolute terms jumped from ₹7 cr to ₹13 cr against revenue growth of just ₹4 cr.
Two explanations are plausible. One, the scrap mix in FY26 was less favorable, with a higher proportion of lower value material that required more input cost to process. Two, as the company tried to fill the new 18,000 MT (Metric Tonne) Vasai facility, it may have had to source material at less favorable terms than its usual MNC contracts.
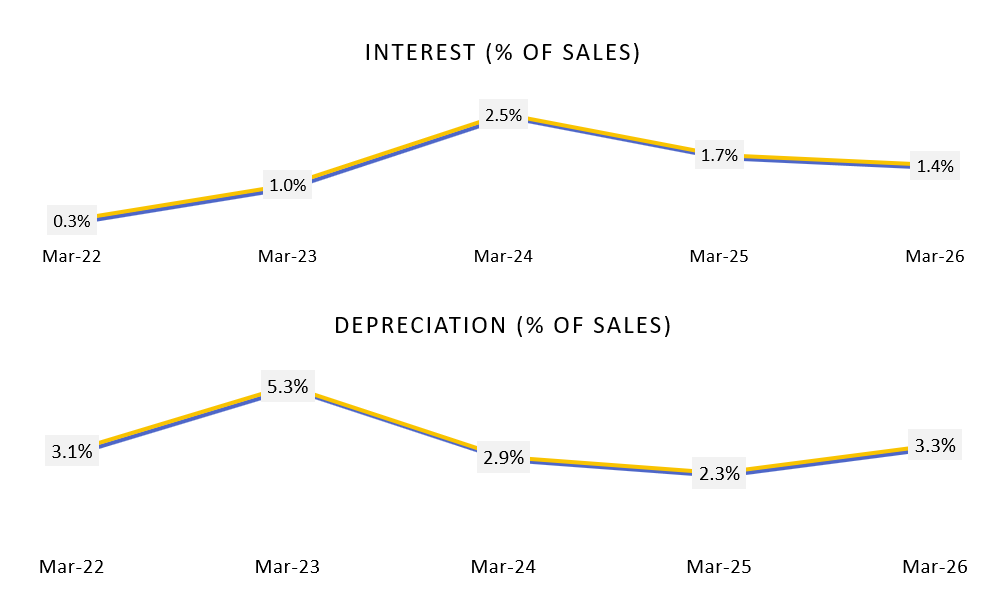
5.2.3 EBITDA:
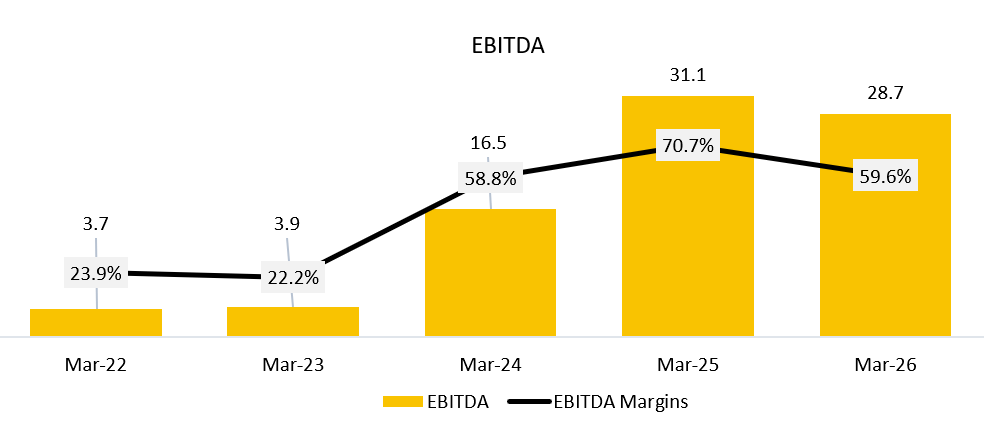
4Y CAGR: 51.1%
The EBITDA story is one of the more striking in this dataset. From a thin 22% to 24% band in FY22 and FY23, margins surged to 58.8% in FY24 and peaked at 70.7% in FY25, before pulling back to 59.6% in FY26. To put this in perspective, absolute EBITDA grew from ₹4 cr in both FY22 and FY23 to ₹31 cr in FY25, nearly an 8x jump in two years
The FY24 and FY25 expansion had two distinct drivers. First, operating leverage kicked in as revenue scaled while employee costs, at roughly ₹94 lakhs per quarter for 50 employees per the Q1 FY25 call, and other fixed costs remained largely stable. Second, and more importantly, EPR fee income began contributing meaningfully, and this revenue stream carries near zero incremental material or processing cost, making it structurally accretive to margins.
The FY26 contraction to 59.6% is explained by the same material cost surge that hit gross profit, compounded by total expenses growing 50.9% in FY26 against revenue growth of only 9.6%. The expense base jumped from ₹13 cr to ₹19 cr, driven by higher material costs, increased depreciation as the new facility came online, and rising professional and courier costs flagged by management on the Q1 FY25 call.
Importantly, management has consistently guided a floor of 40% EBITDA margin, citing their focus on value over volume. At 59.6%, the company remains well above that floor, but the gap has narrowed and the direction of travel deserves attention.
5.2.4 Net Profit:
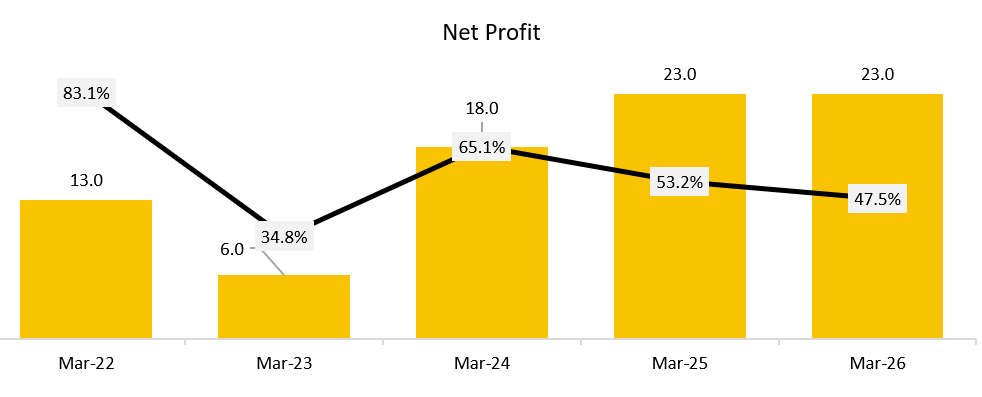
4Y CAGR: 12.5%
Net profit is the trickiest line to analyse here because of the significant role other income has played, particularly in the early years. In FY22, other income of ₹11 cr was nearly 73% of sales of ₹15 cr, comprising investment income, fair value gains on investments, dividend and interest receipts. This single line inflated the FY22 net profit margin to 83.1% and PBT (Profit Before Tax) margin to a seemingly extraordinary 93%, numbers that look nothing like an operationally driven business.
The picture normalizes significantly as you move through the years. Other income as a percentage of sales fell sharply from 72.5% in FY22 to 21.4% in FY23, 25.9% in FY24, and then to just 5.3% in FY25, recovering modestly to 9.6% in FY26. This normalization is a healthy and important signal. It means the company’s reported profits are increasingly a reflection of what the recycling and EPR business is actually generating, rather than treasury and investment activities. Management has been gradually liquidating investments, which also explains why other income bounced slightly in FY26 as fair value gains came through.
On a purely operational basis, the net profit trajectory is strong through FY25 but stalls in FY26. Net profit grew from ₹6 cr in FY23 to ₹18 cr in FY24 and ₹23 cr in FY25, then remained flat at ₹23 cr in FY26 despite revenue adding another ₹4 cr.
Two factors explain the stall.
First, tax provisioning has been a consistent drag at ₹8 cr in both FY25 and FY26, up from ₹4 cr in FY24, reflecting the higher profitability base and a shift in income mix away from long term capital gains which attract lower tax rates, towards operating income.
Second, the GP compression from the material cost surge directly flowed through to the bottom line. PAT (Profit After Tax) margin has consequently eased from 53.2% in FY25 to 47.5% in FY26, a meaningful step down, though still a level most businesses would envy.
5.2.5 Balance Sheet:
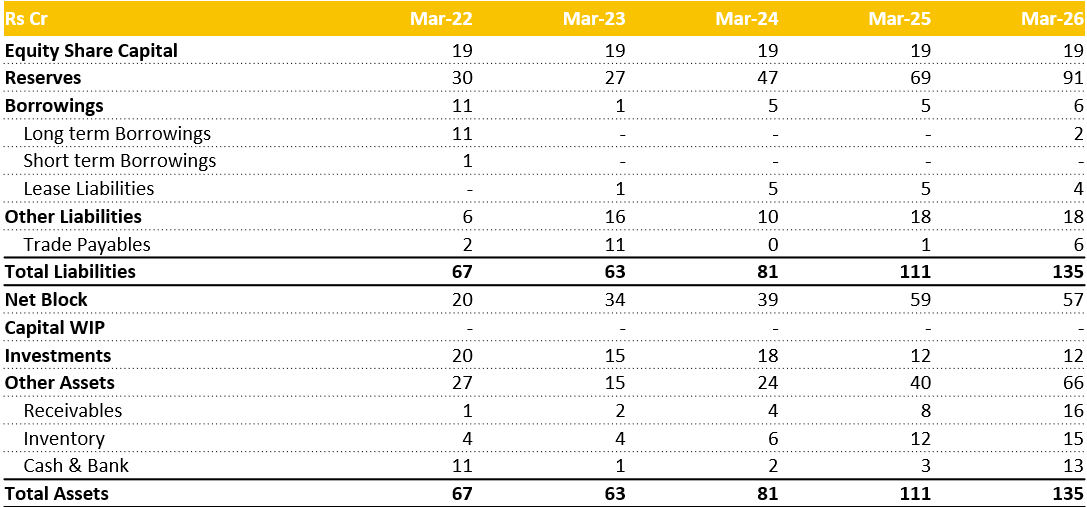
Receivables
Receivables have grown from ₹1 cr in FY22 to ₹16 cr in FY26, and more concerningly, as a percentage of total assets from 1.5% to 11.6%. Revenue over the same period grew roughly 3x, but receivables grew 16x.
This is a meaningful divergence. A likely explanation is the EPR (Extended Producer Responsibility) credit mechanism, where credits are uploaded on the CPCB (Central Pollution Control Board) portal and fees are collected from producers, but timing mismatches between recycling, credit generation and actual cash collection can stretch debtor days.
The portal shutdown episode in March to April 2024 is a live example of how receivables can build up when the system stalls. This trend warrants close watching.
Inventory
Inventory has grown from ₹4 cr in FY22 to ₹15 cr in FY26, moving from 6.5% to 11.5% of total assets. Management acknowledged on the Q1 FY25 call that purchases made in one quarter do not necessarily get consumed in the same quarter, as batching decisions depend on what mix of metals can be optimally extracted.
This explains some inventory build. However, the sharp jump from ₹12 cr in FY25 to ₹15 cr in FY26, alongside the material cost surge, suggests the company may be holding higher cost inventory that has not yet been processed into revenue. If the scrap mix is less favorable, as suspected in the GP analysis, sitting on that inventory is a double edged situation.
Trade Payables
Trade payables show an unusual pattern. They spiked to ₹11 cr in FY23, collapsed to near zero in FY24, and have since recovered to ₹6 cr in FY26. The FY23 spike likely reflects a period when the company was actively procuring material from the market before its MNC (Multinational Corporation) contract base was fully established.
The near elimination in FY24 aligns with management’s stated model of sourcing directly from producers who often bear the cost themselves, reducing the need for Ecoreco to pay upfront. The FY26 recovery to ₹6 cr alongside the material cost jump suggests some market procurement may have resumed to fill the new Vasai facility.
Cash and Bank
Cash position has been volatile, falling sharply from ₹11 cr in FY22 to ₹1 cr in FY23, as the company deployed capital into net block and investments. It remained thin through FY24 and FY25 at ₹2 cr and ₹3 cr respectively, before recovering to ₹13 cr in FY26.
Management explicitly stated on the Q1 FY25 call that they were accumulating cash and would evaluate further capacity investment around September 2025 based on utilization trends. The FY26 cash build is consistent with this stated intent.
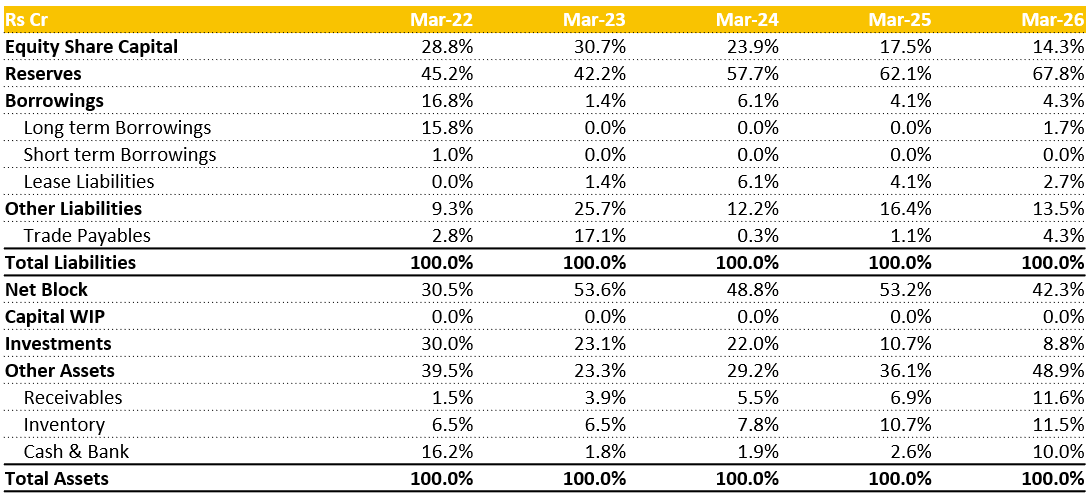
5.2.6 Common-Size Balance Sheet:
5.2.7 Cash Flow Analysis:
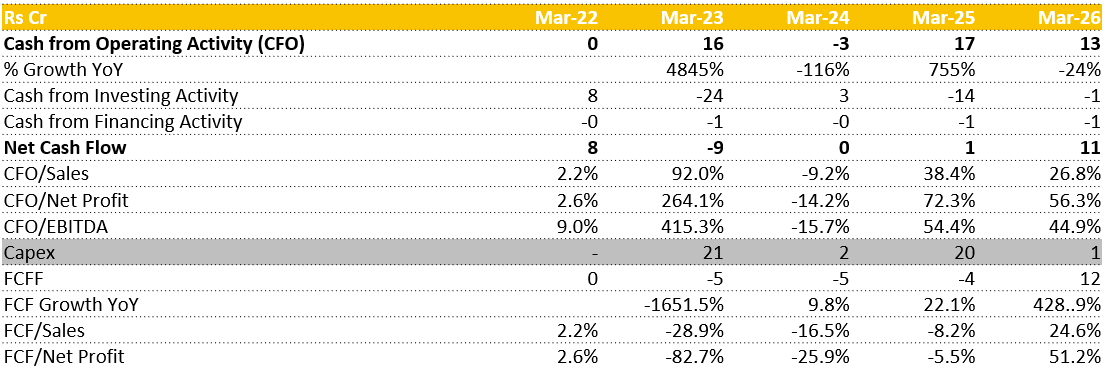
CFO
After a strong ₹16 cr in FY23, CFO collapsed to negative ₹3 cr in FY24, recovered to ₹17 cr in FY25, and came in at ₹13 cr in FY26. The FY24 collapse despite profit from operations jumping to ₹17 cr is entirely explained by working capital (WC) consumption of ₹15.78 cr. Receivables consumed ₹2 cr, inventory ₹2.17 cr, and most significantly payables swung by ₹10.51 cr as trade creditors were paid down sharply, consistent with the balance sheet showing trade payables collapsing from ₹11 cr to near zero in FY24.
Additionally tax outflow jumped to ₹3.87 cr in FY24 from ₹1.26 cr in FY23. So a year of record operating profit was effectively a cash drain. FY25 recovered strongly to ₹17 cr as profit from operations hit ₹32.18 cr and WC consumption moderated to ₹6.92 cr.
However FY26, despite profit from operations further improving to ₹33.98 cr, saw CFO drop to ₹13 cr due to WC consumption worsening again to ₹13.53 cr. Receivables alone consumed ₹8.06 cr in FY26, consistent with the receivables build flagged in the balance sheet analysis.
CFI
FY23 saw a massive CFI outflow of ₹24 cr driven by fixed asset purchases of ₹21.44 cr, this was the Vasai facility under construction. Simultaneously the company was liquidating its investment portfolio, with ₹59.13 cr of investments sold in FY23 and ₹5.16 cr in FY24, which funded both operations and capex. By FY25 and FY26 the investment liquidation has largely run its course, with investments sold at zero, consistent with the balance sheet showing investments stabilizing at ₹12 cr.
FY25 saw another capex cycle of ₹20.49 cr as the new facility was completed and commissioned, resulting in CFI of negative ₹14 cr. FY26 capex has normalized sharply to just ₹1.06 cr, suggesting the heavy investment phase is now behind the company. This is what drove the FCF recovery to ₹12 cr in FY26.
CFF
CFF has been consistently negative and small across the recent years, reflecting a company that is debt free in operational terms and returning cash via borrowing repayments. Long term borrowings were fully repaid by FY23, and the small outflows in FY24, FY25 and FY26 are primarily lease liability repayments.
There are no equity raises, no meaningful debt additions, and no dividends visible in the data. The entire capacity expansion of ₹50 cr has been funded through internal accruals, as management repeatedly emphasized across both concalls.
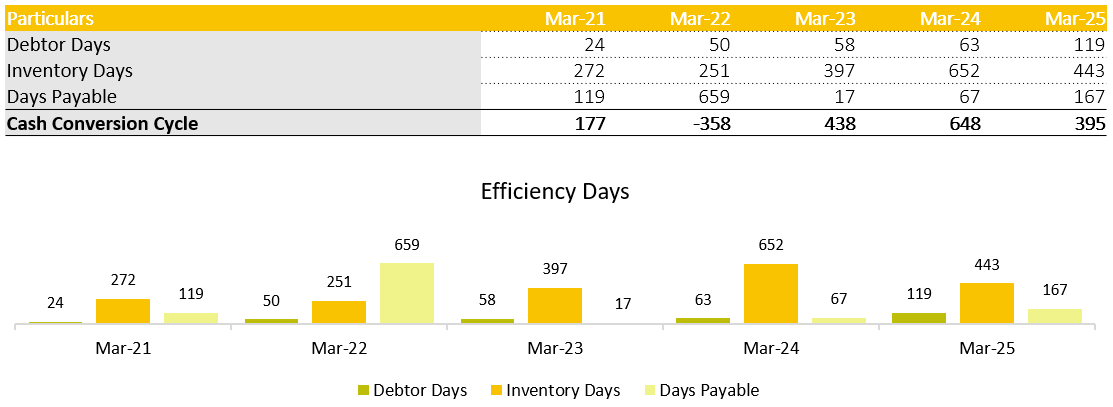
5.2.7 Cash Conversion Cycle:
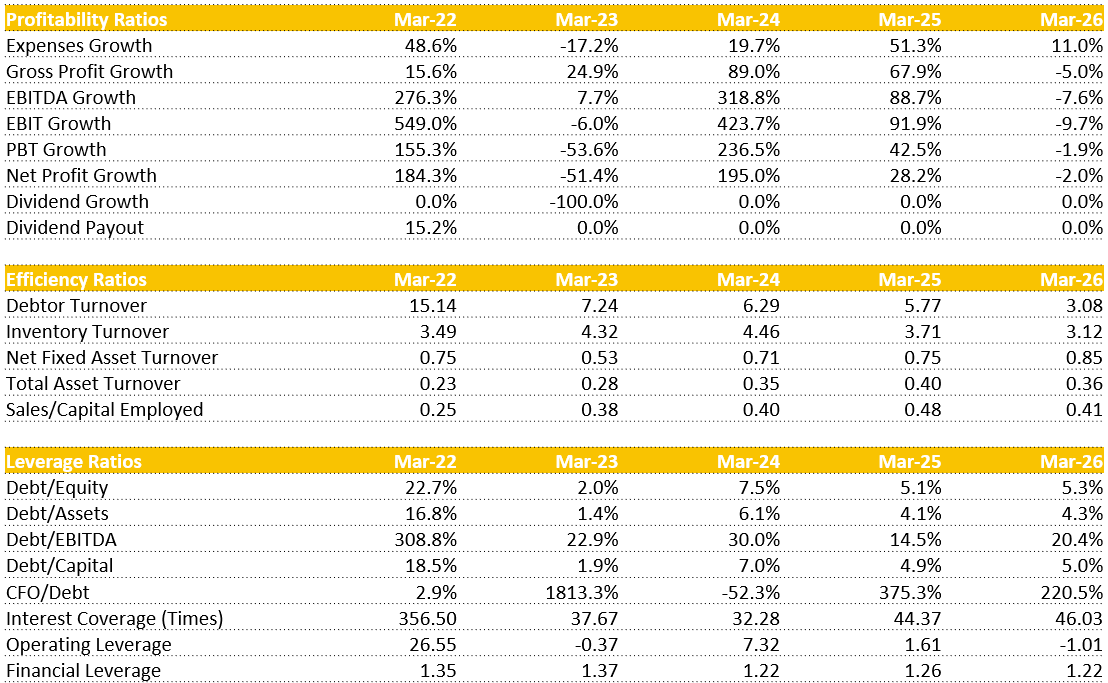
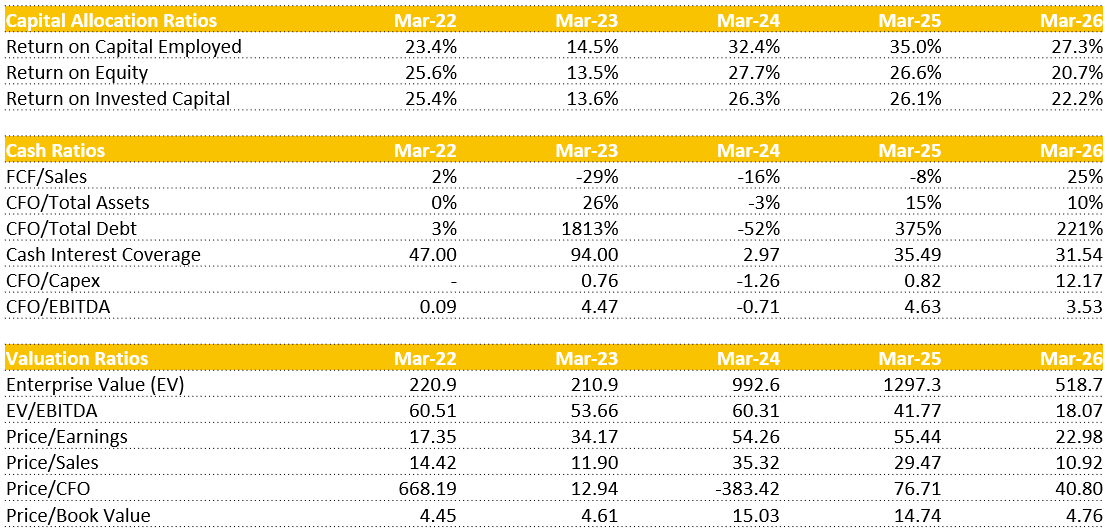
6. Key Ratios:
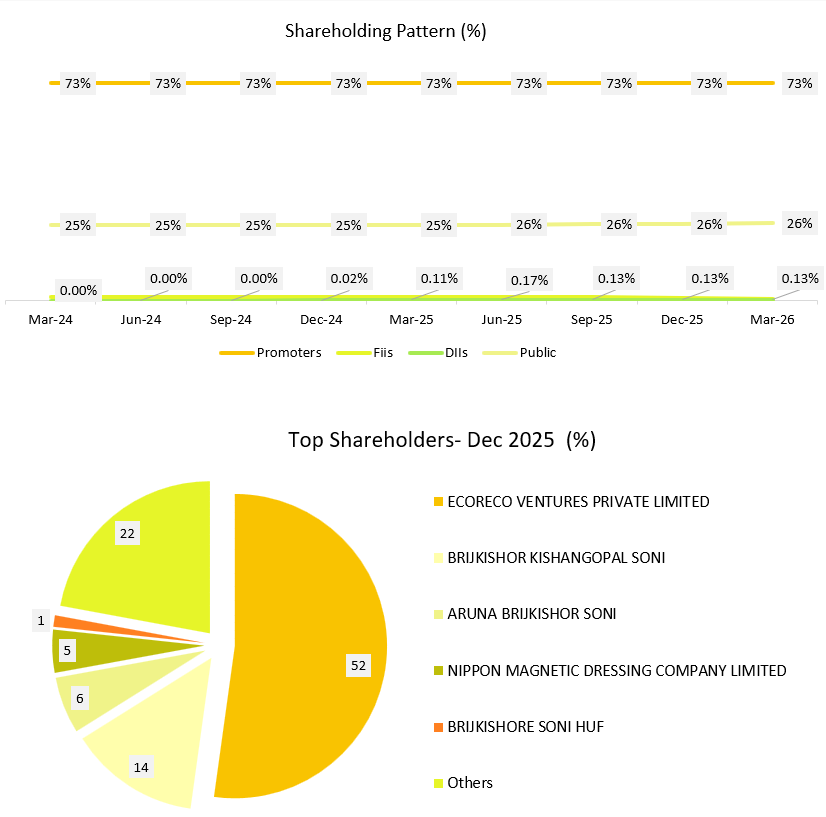
7. Shareholding Pattern:
Promoter holding remains highly stable at ~73%, indicating strong control, while public shareholding stays around 25–26% with minor fluctuations.
8. Con-call Analysis (Q4 FY26):
1. Company Overview: India’s E-waste Pioneer
Pioneering Status: Ecoreco is positioned as India’s first and a leading e-waste management company, with a legacy of over 22 years since its inception in 2005.
Integrated Service Portfolio: The company offers a “360° Circular Portfolio” of end-to-end e-waste solutions, including:
E-waste & Lamp Recycling.
IT Asset Disposition (ITAD) & Refurbishment.
Secure Data Destruction.
Reverse Logistics.
EPR (Extended Producer Responsibility) & CSR Implementation.
Technological Leadership: Ecoreco leverages a mix of imported technologies (from the US, Europe, Japan) and in-house R&D. It has been a first-mover in key innovations.
Key Innovation: “Recycling on Wheels” (SmartER): This is a standout offering India’s first mobile e-waste recycling and data destruction unit. It provides on-site, secure services, which is a critical requirement for data-sensitive clients like banks and MNCs. This initiative has been endorsed by the PMO.
2. Strategic Initiatives & Capacity Expansion
Ecoreco is aggressively expanding its capacity and capabilities to capture the growing e-waste opportunity.
Massive Capacity Expansion: Total e-waste recycling capacity has been increased to 31,200 MTPA. This includes a new, significant capability:
Li-ion Battery Recycling: A crucial new venture.
Capacity: Commissioned 6,000 MTPA capacity for Black Mass production.
Technology: Developed in collaboration with government bodies C-MET & MeitY.
Strategic Importance: Targets recovery of critical minerals (Cobalt, Nickel, Manganese) and reduces India’s import dependency.
Funding: The entire expansion was funded through internal accruals, highlighting the company’s financial strength.
Digital Infrastructure: The “Book My Junk” mobile app and web platform, along with the “Eco-Bin” initiative (100,000 bins deployed), create a robust ecosystem for e-waste collection from both B2C and B2B sources.
3. Industry Landscape & Regulatory Tailwinds
Accelerated E-waste Generation: India is the 4th largest e-waste generator globally. E-waste is projected to grow from ~6.19 MMT in 2024 to 14 MMT by 2030.
Formal vs. Informal Sector: The formal recycling sector currently accounts for only 22% of the infrastructure but has a very high recovery rate (95-97%). The informal sector (78%) is inefficient (10-20% recovery), leading to a huge “value leakage” of ₹21,250 crores.
The EPR Catalyst: The E-Waste (Management) Rules, 2022 are a game-changer.
They mandate strictly escalating recycling targets for Producers, Importers, and Brand Owners (PIBOs), rising from 60% (2023-25) to 80% (2027 onwards).
This creates a guaranteed, growing market for formal recyclers like Ecoreco, who can generate and sell the EPR certificates that PIBOs need to prove compliance.
Non-compliance for PIBOs results in heavy fines (Environmental Compensation), making the purchase of EPR credits from formal recyclers a form of “insurance.”
9. SWOT ANALYSIS:
Strengths
First-Mover Advantage with Strong Technical Expertise: Established in 2005 as India’s first e-waste recycler, the company has built a 20-year operational track record and a proprietary 5-step recovery process achieving 95–97% recovery efficiency, significantly ahead of the informal sector.
Large-Scale Specialized Recycling Infrastructure: Operates a 65,000 sq. ft. facility in Mumbai with 31,200 MTPA processing capacity, including a dedicated 6,000 MTPA lithium-ion battery recycling line focused on Black Mass and critical mineral recovery.
Extensive Collection and Reverse Logistics Network: Supported by 100,000+ Eco-Bins, nationwide reverse logistics coverage, and the “Book My Junk” digital platform, enabling streamlined collection and processing across B2B and B2C channels.
Strong Global Integration and Compliance Reach: Membership in the global TERRA network allows servicing clients across 120 countries and 6 continents, strengthening credibility in IT asset disposition (ITAD) and cross-border recycling compliance.
Weaknesses
High Geographic Concentration of Processing Assets: Core recycling operations are centralized in Mumbai, increasing logistics costs and operational dependency on a single hub for nationwide waste processing.
Complex Multi-Category Processing Requirements: Handling 106 types of electronic equipment across multiple waste categories increases operational complexity, specialized equipment requirements, and process recalibration costs.
Operational Burden of Large Collection Network: Managing and maintaining 100,000 physical collection bins nationwide creates logistical inefficiencies, contamination risks, and recurring maintenance overheads.
Dependence on Collaborative R&D Ecosystem: Expansion into advanced lithium-ion mineral extraction remains partly dependent on partnerships with external government research bodies, potentially limiting speed of independent innovation.
Opportunities
Strong Regulatory Tailwinds from EPR Mandates: Rising mandatory recycling targets under India’s E-Waste Management Rules 2022 (60% → 80% by 2027) are expected to sharply increase demand for formal recycling and EPR credit generation.
Massive Growth in Domestic E-Waste Generation: India’s e-waste generation is projected to more than double by 2030, creating a large addressable market for organized recyclers with scalable infrastructure.
Strategic Positioning in Critical Mineral Recovery: Recovery of Cobalt, Nickel, and Manganese creates an opportunity to become a domestic supplier for India’s growing EV battery and clean energy ecosystem.
Government and Smart City Integration Potential: Endorsements linked to Smart City initiatives and municipal recycling integration can provide access to large-scale government waste management contracts.
Industry Formalization and Market Consolidation: Stricter compliance enforcement and GST-linked recycling verification are likely to shift waste volumes away from the informal sector toward certified recyclers.
Threats
Dominance of Informal Recycling Networks: The informal sector continues to process the majority of India’s e-waste through cash-based collection models, creating sourcing competition for organized recyclers.
Rising Safety Risks from Lithium-Ion Waste: Increasing presence of lithium-ion batteries raises risks of thermal runaway, fires, and hazardous storage incidents, potentially increasing compliance and insurance costs.
Technological Changes in Device Design: Growing miniaturization and integrated hardware designs make dismantling and material separation more difficult, reducing recovery efficiency of existing processes.
Weak National Collection Infrastructure: Limited collection center penetration across India restricts organized accumulation of e-waste and may slow capacity utilization growth.
10. Competitors:
10.1 Namo eWaste Management Ltd.
Market Cap: ₹ 550 Cr.
Namo eWaste Management Ltd., headquartered in India, operates in the electronic waste management and recycling industry. The company specializes in collection, recycling, dismantling, and processing of electronic waste generated from consumer electronics, IT equipment, and industrial electrical products.
Business Model:
Namo eWaste Management operates a collection, recycling, and resource recovery model, serving corporate, institutional, and industrial clients.
The company collects and processes electronic waste such as computers, mobile devices, servers, batteries, and electrical equipment.
Revenue is generated from recycling services, disposal contracts, and recovery of valuable metals/materials.
It works with corporates, manufacturers, government entities, and producers under EPR regulations.
The company operates authorized recycling and dismantling facilities complying with environmental standards.
The business benefits from increasing focus on formal recycling and stricter environmental compliance regulations.
What sets them apart:
Focused E-Waste Recycling Player: Specialized in electronic waste management and material recovery.
Beneficiary of Environmental Regulations: Growth driven by EPR and sustainability requirements.
Resource Recovery Capabilities: Recovery of metals and reusable materials from e-waste.
Exposure to Circular Economy Trends: Increasing demand for organized recycling infrastructure in India.
10.2 Nupur Recyclers Ltd.
Market Cap: ₹ 392 Cr.
Nupur Recyclers Ltd., headquartered in New Delhi, operates in the metal recycling and non-ferrous metal processing industry. The company is engaged in recycling and trading of ferrous and non-ferrous metal scrap, primarily focusing on aluminum, copper, brass, and zinc-based products.
Business Model:
Nupur Recyclers operates a metal recycling and processing business model, converting scrap metals into reusable industrial raw materials.
The company procures domestic and imported metal scrap.
It processes and supplies recycled metals to manufacturers and industrial customers.
Revenue is generated from metal trading, recycling operations, and value-added metal products.
The company benefits from demand across electrical, automotive, construction, and engineering industries.
The business is influenced by global metal prices and increasing focus on sustainable material usage.
What sets them apart:
Non-Ferrous Metal Recycling Expertise: Focus on aluminum, copper, brass, and zinc recycling.
Sustainability-Driven Industry: Beneficiary of increasing recycled metal adoption.
Integrated Processing Operations: Scrap sourcing, processing, and supply chain capabilities.
Exposure to Industrial Demand: Supplies recycled metals to multiple manufacturing sectors.
10.3 Race Eco Chain Ltd.
Market Cap: ₹ 218 Cr.
Race Eco Chain Ltd., headquartered in Noida, Uttar Pradesh, operates in the battery recycling and resource recovery industry. The company is engaged in recycling lead-acid batteries and recovery of metals and other reusable materials, supporting circular economy and environmental sustainability initiatives.
Business Model:
Race Eco Chain operates a recycling and resource recovery business model, focused on organized battery collection and material processing.
The company collects and processes used lead-acid batteries and battery scrap.
Revenue is generated from sale of recovered lead and recycled materials.
It works with battery manufacturers, dealers, recyclers, and industrial customers.
The company operates recycling facilities compliant with environmental and pollution control standards.
The business benefits from increasing adoption of formal recycling channels and environmental compliance regulations.
What sets them apart:
Battery Recycling Focus: Specialized in lead-acid battery recycling and metal recovery.
Circular Economy Exposure: Supports sustainable recycling and resource reuse.
Organized Collection Network: Works across battery collection and recycling supply chain.
Beneficiary of Environmental Regulations: Growth supported by stricter recycling and waste management policies.
Thank You So Much For Reading!!
Researched By- Naresh, Mayank and Vaibhav
All information is sourced from the company’s annual reports, Press Release, News Articles, GoIndiastocks.in, Screener.in, industry reports, and Economy Outlook reports.
Disclaimer: We do not recommend buying or selling any stock. You should consult your financial advisor before buying or selling any financial instrument.
We are Proud to Announce Our New Launch of the Premium services where we Deep-dive into the Business and back you up with Robust Research.
We Provide services for different Level of Investors. You can Email us directly to start your journey!