


Hi again! Welcome to the 3rd edition of our small-cap coverage. Today, we're diving into a new Engineering (Foundry) company: “Disa India Ltd”. Let's start! But before we do, here is the link to the second edition.
Stock Performance
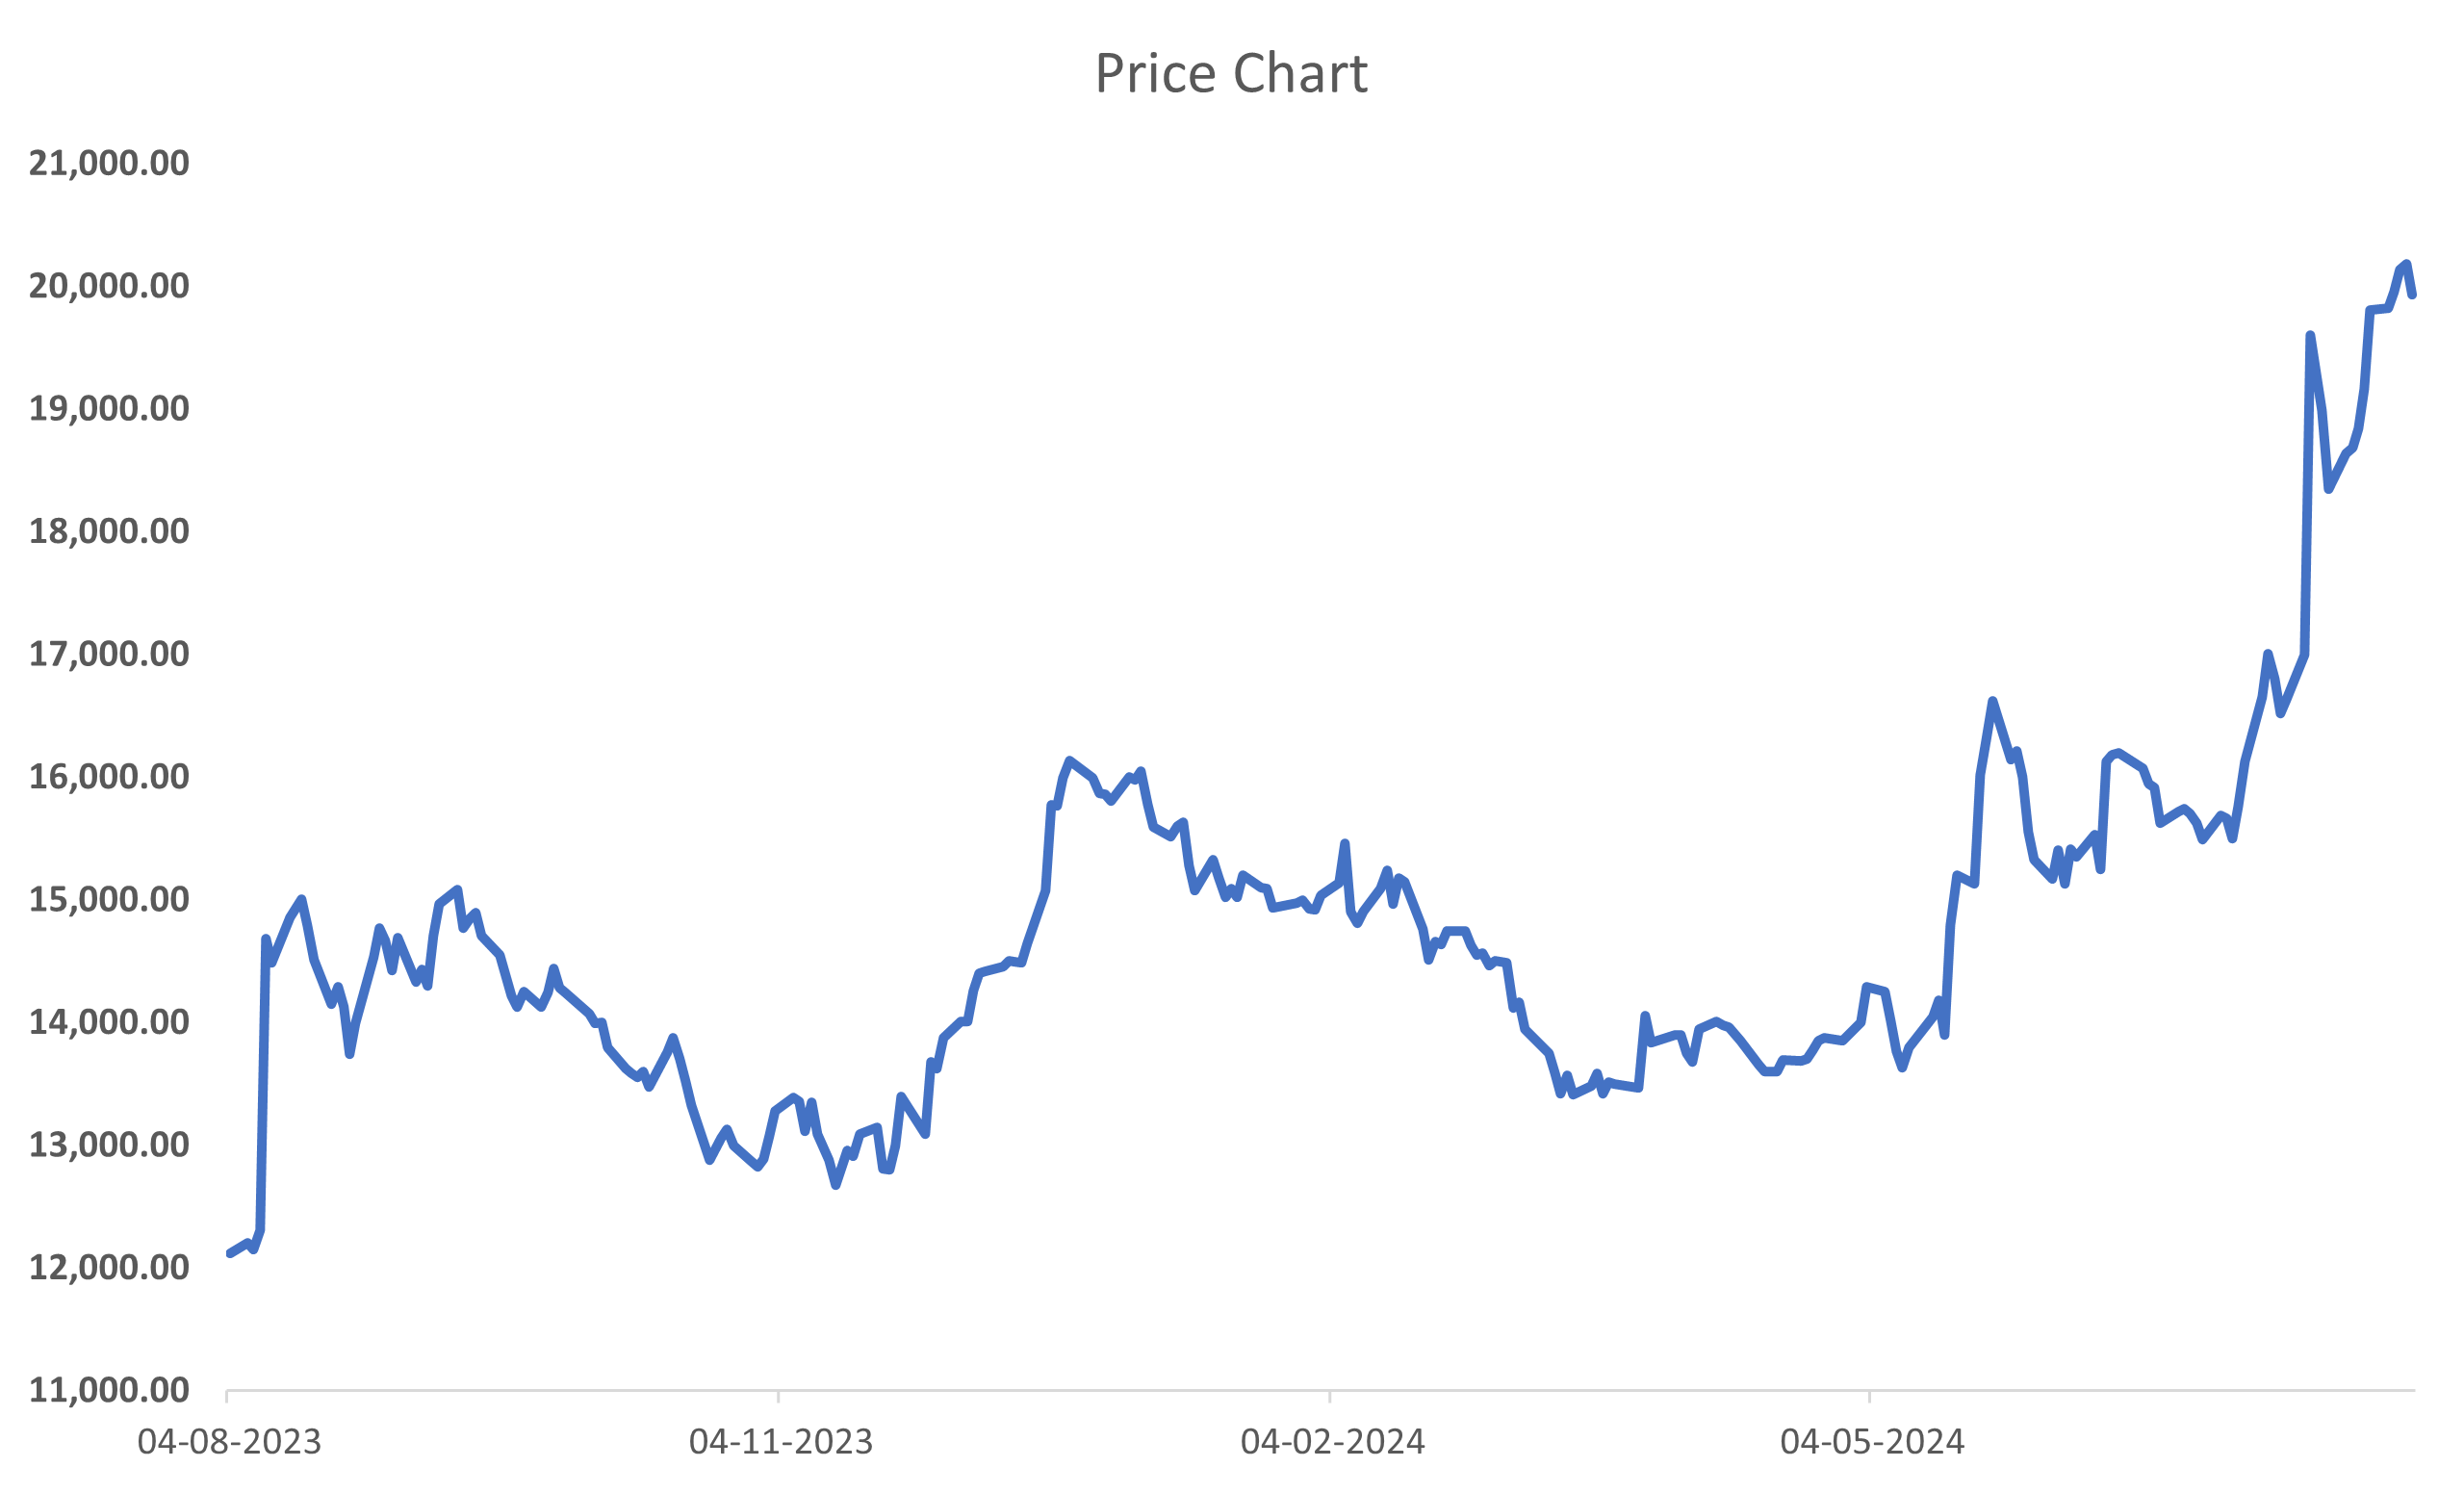
Comparison with NIFTY50
*Indexed on 04 Aug 2023 (=100)
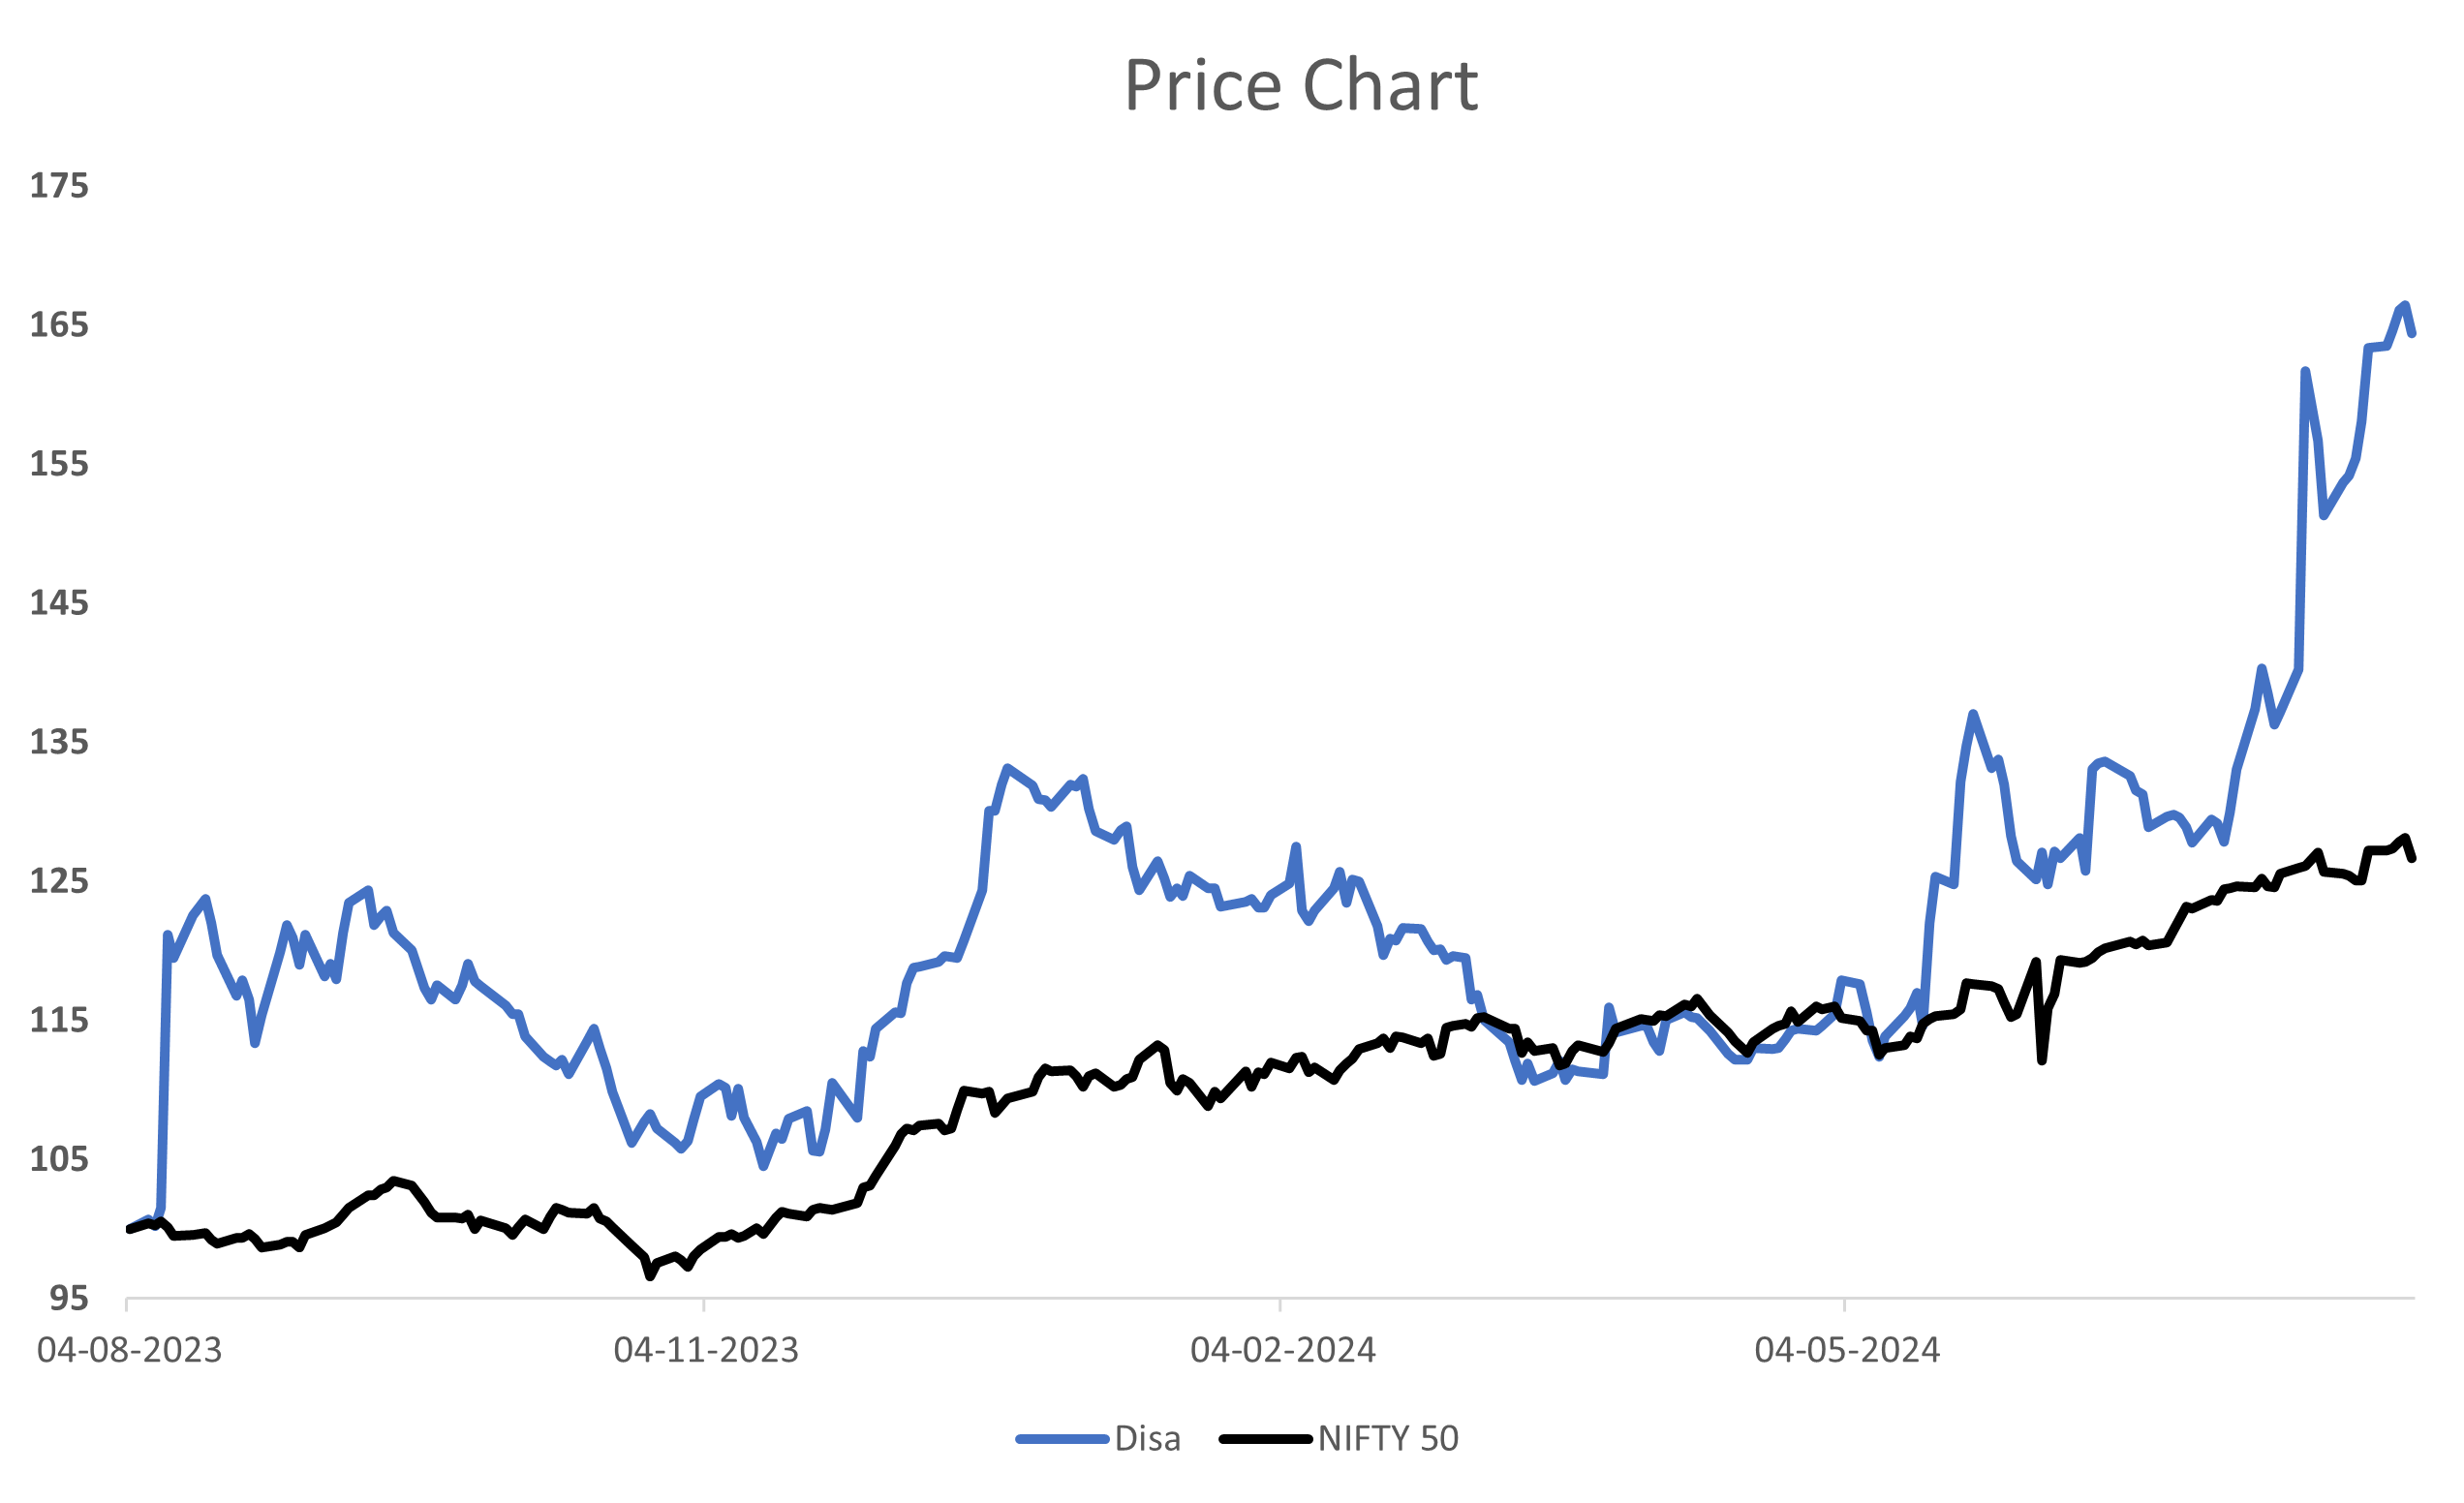
Comparison with NIFTY SMALLCAP 50
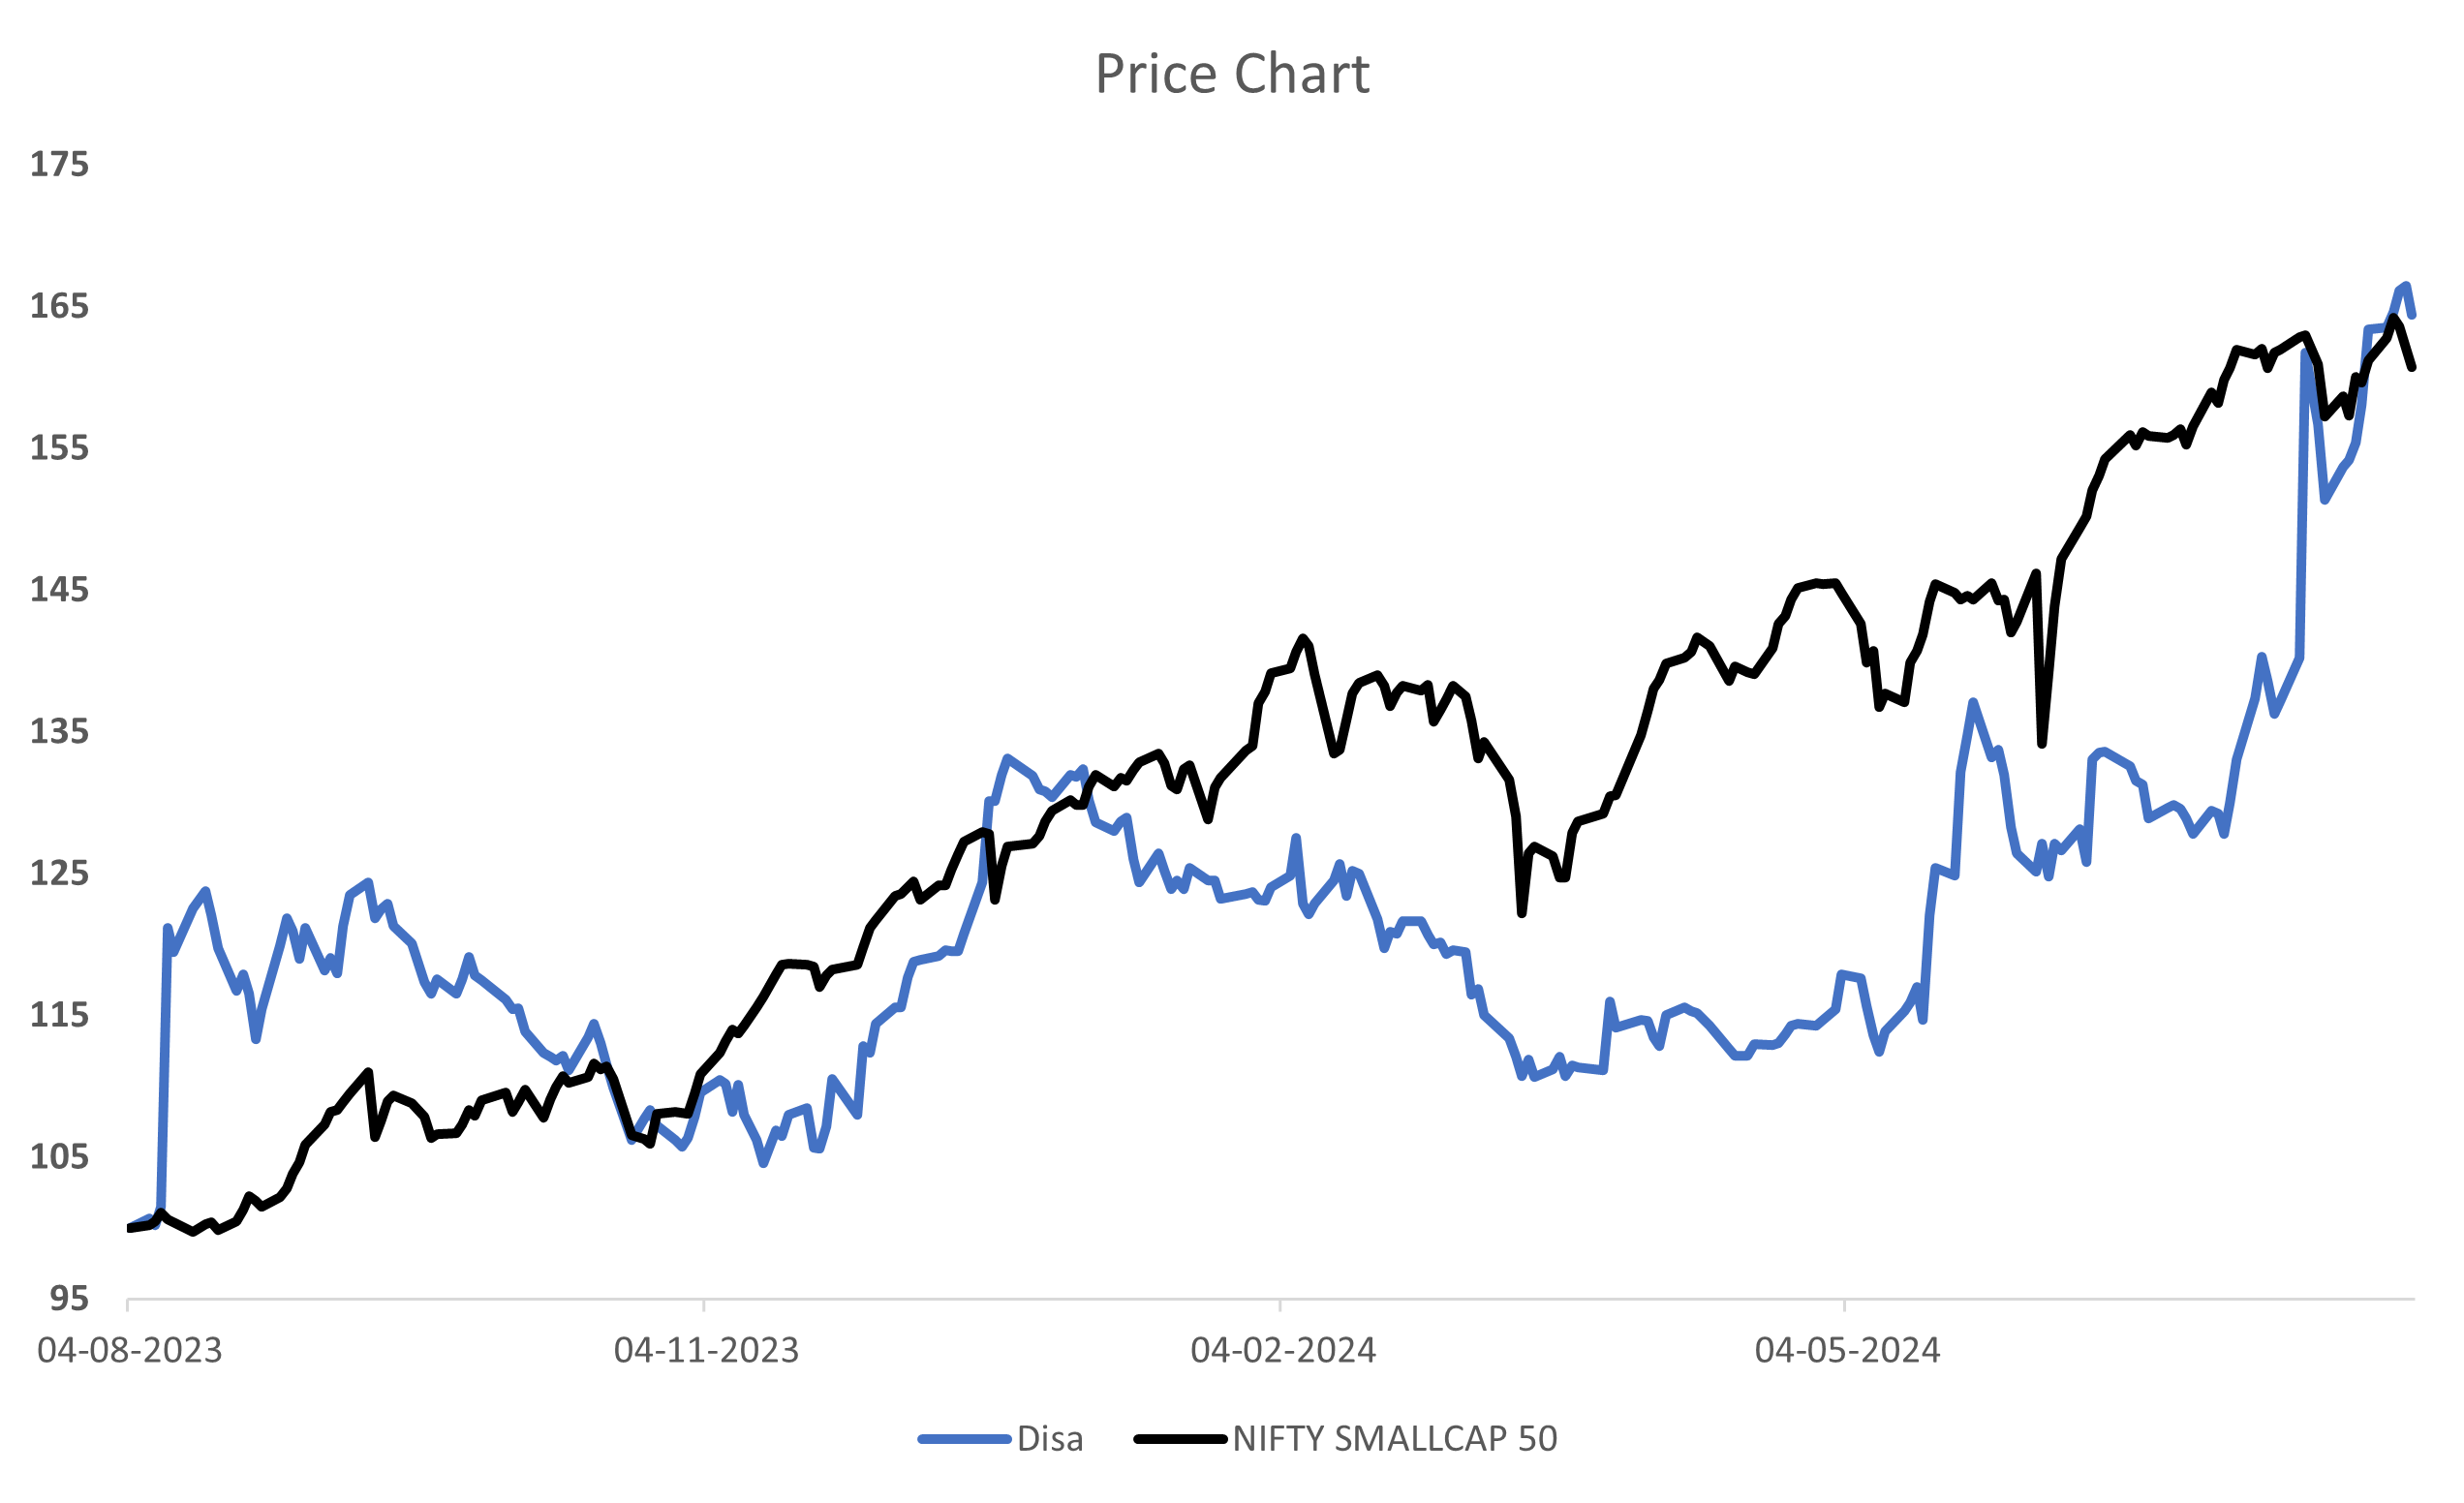
*Indexed on 04 Aug 2023 (=100)
About Company -

DISA India Ltd. is a leading manufacturer and supplier of foundry machinery and metal casting solutions. Here’s a brief overview:
Industry: Machinery
Description: DISA India Ltd. Provides a wide range of products, including molding machines, sand mixers, and complete foundry systems.
Headquarters: Bangalore, India
Established: 1984
Key Products: Molding Machines, Sand Mixers, Complete Foundry Systems
Stock Symbol: DISA
Market: BSE (Bombay Stock Exchange)
The company plays a significant role in the metal casting and foundry machinery sector, offering comprehensive solutions to its clients.
Company Operations
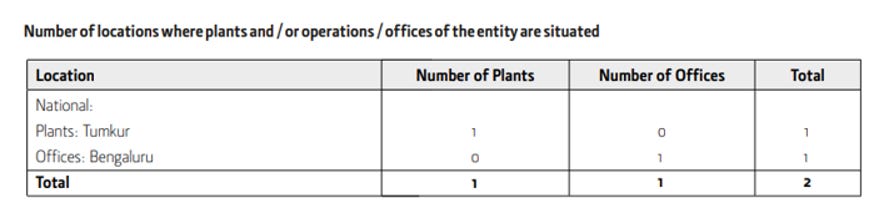
Markets Served By the Company
Management Overview –
Managing director –
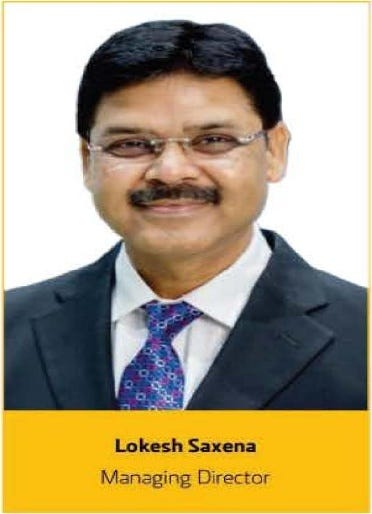
▪ BE (Mechanical), MBA (Marketing)
▪ Leadership & Management programs at INSEAD, ISB and CEIBS
▪ 24+ years of experience in Turnaround and building businesses
In Automotive, Industrial, and Services in both OEM and
Aftermarket operations
Chairperson –

▪ Master’s degree in Finance and an Executive MBA degree from
SIMI, Copenhagen
▪ Board member since August 2006
▪ 20 + years of experience in business management
Chief Financial Officer –
Mr. Amar Nath Mohanty (up to 22.04.2024)
Ms. Vidya Jayant ( from 23.04.2024)
Company secretary and Compliance officer-
Ms. Shrithee M S (up to 29.04.2024 and from 23.05.2024)
Key Managerial Personnel (KMP) Remuneration
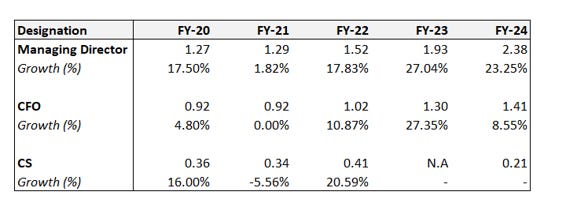
All fig. in Crores
CS resigned in FY-23
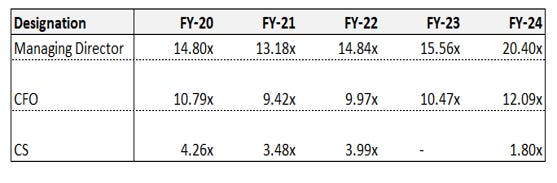
KMP Remuneration to Median Employee Remuneration
Company Performance Overview
The Company recorded its all-time high revenue from operations at ₹ 3,19.15 crores for FY 2023-24. This was on the back of a good order book at the commencement of the year, higher exports, a powerful aftermarket, and the servicing of new geographies. The company's strategic areas during the year spanned sound supply chain management, cost controls, discretionary spend management, and cash conservation. To this were added efforts toward expanding sales and market activity overseas, particularly in the Middle East, Africa, and CIS countries.
Margin Management and Strategic Initiatives
The company has been able to hold on to good margins, as the impact of higher input material costs was offset by strategic price increases, advanced buying strategy, and higher aftermarket parts revenue. All these factors together balanced the pressure on costs.
Market Environment and Sector Performance
During the years 2023-24, the automotive sector was on a sound revival track, driven by the revival of economic activities and increased mobility. Besides, infrastructure industries such as Railways, Renewable Energy, Steel, Cement, Airports, Ports, and Exports were in growth mode. Orders from most of these infrastructure industries also supported the growth of its major businesses. This market environment thus helped the company to maintain its market share in all major businesses.
Company Product & Services
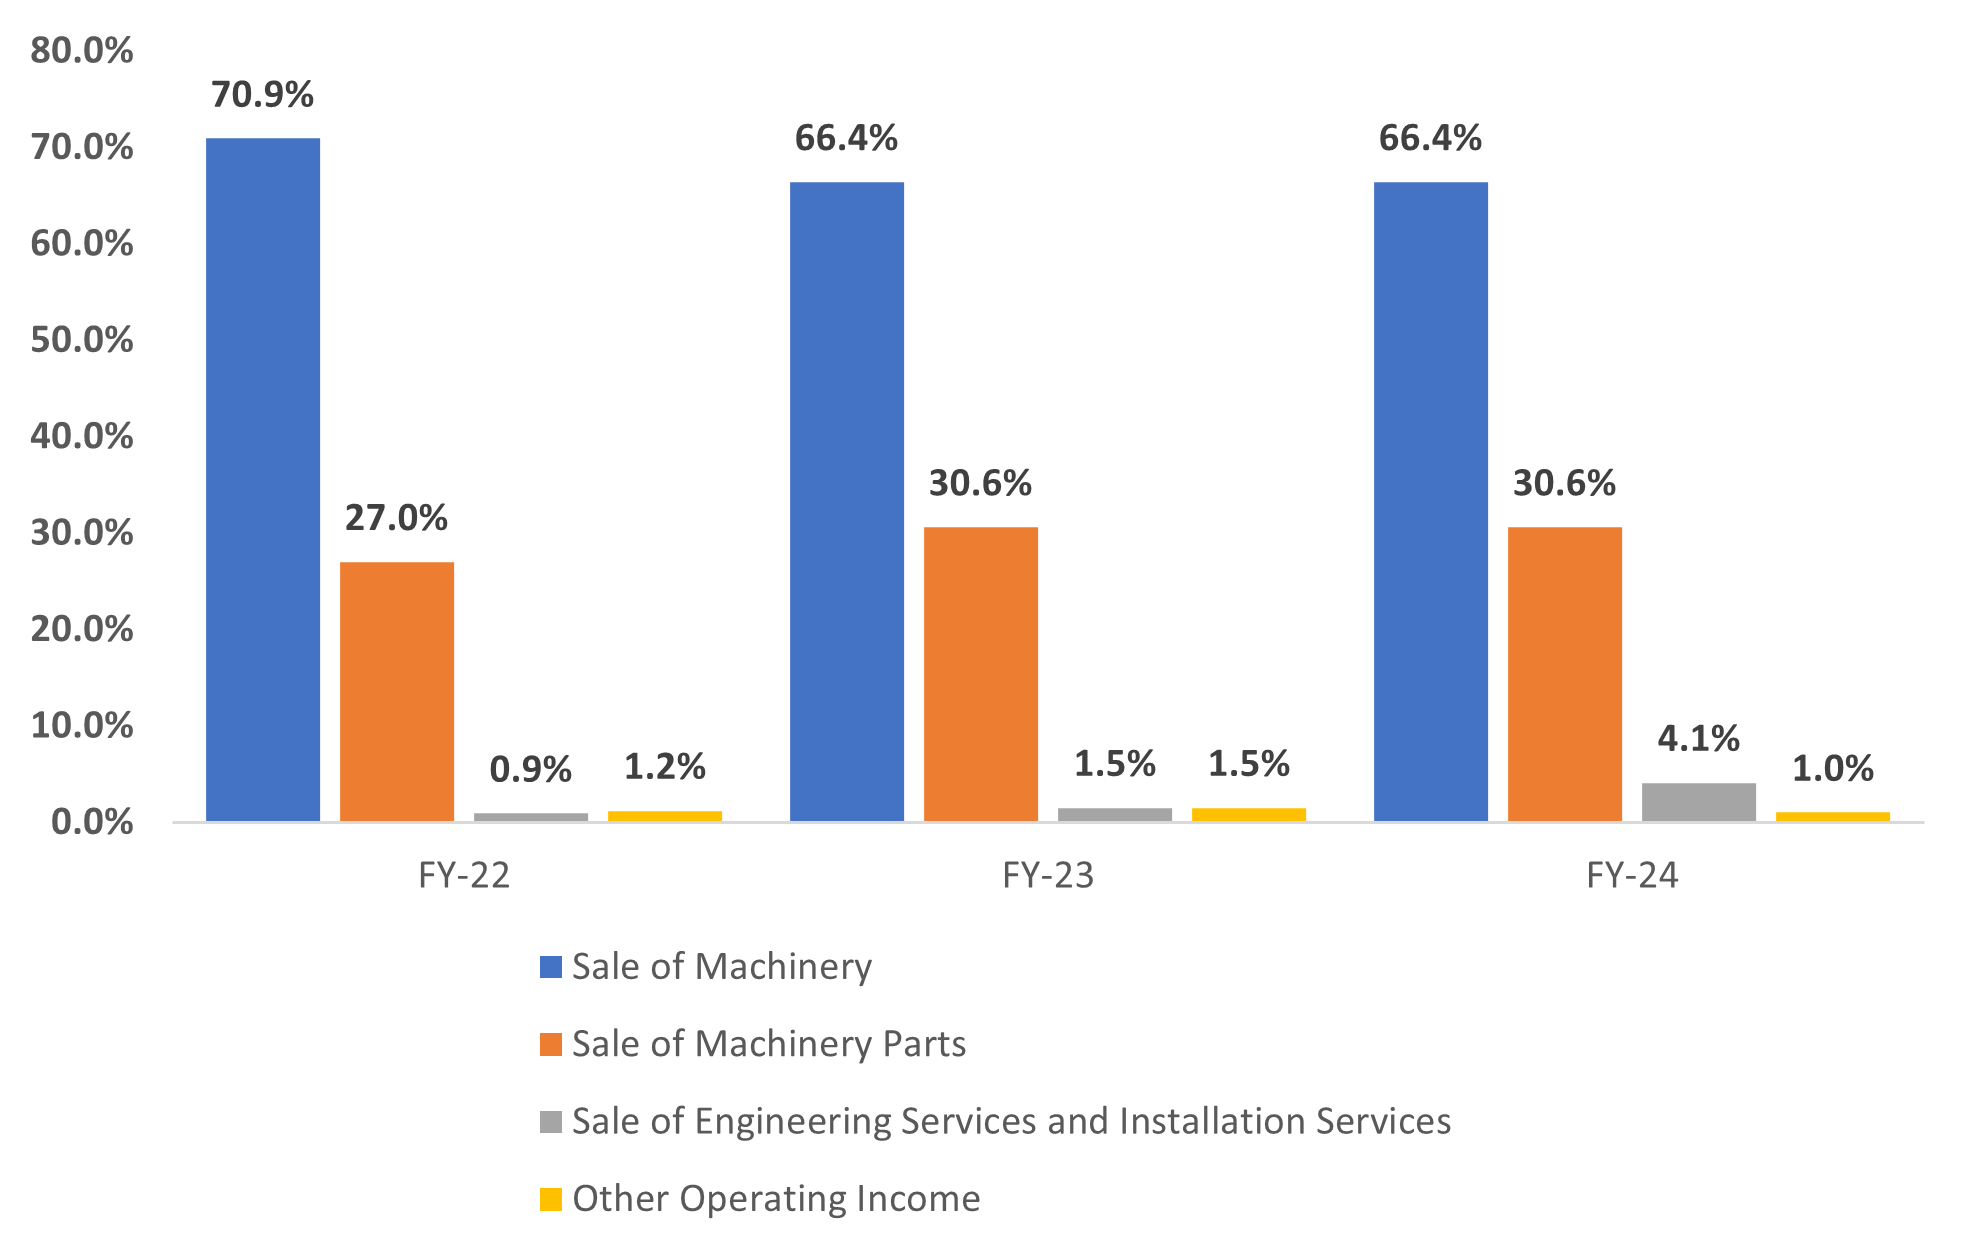
Dominance of Sale of Machinery: The sale of machinery is the primary revenue driver, consistently contributing over 60% of the total revenue in all three financial years.
Stable Machinery Parts Revenue: The sale of machinery parts constitutes a relatively stable portion of the total revenue, hovering around the 30% mark.
Growing Importance of Services: The combined share of engineering services, installation services, and other operating income has increased over the years, suggesting a growing emphasis on these segments.
Minor Revenue Streams: Engineering services, installation services, and other operating income remain relatively small components of the overall revenue.
The company's revenue is heavily reliant on the sale of machinery.
Diversification efforts into services and other operating income are underway but still contribute modestly to the overall revenue.
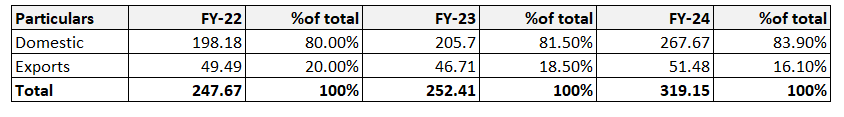
Dominance of Domestic Revenue:
Domestic revenue consistently constitutes the major portion of total revenue across all three years.
The percentage of domestic revenue has shown a slight increase from 80% in FY22 to 83.9% in FY24.
Decreasing Export Revenue:
Export revenue has declined as a percentage of total revenue from 20% in FY22 to 16.1% in FY24.
While the absolute value of export revenue increased between FY22 and FY23, it declined slightly in FY24.
Overall Revenue Growth:
The total revenue has grown steadily from FY22 to FY24.
Implications:
The company has a strong domestic market presence, which has been growing in importance over the years.
While there has been some growth in export revenue, its contribution to the overall revenue has decreased.
Key performance indicators for Disa India Limited –
1. Revenue and Earnings :
- Revenue has shown a strong growth trajectory, with an increase from INR 261.9 Crores in March 2023 to INR 328.6 Crores in March 2024.
- Net profit margins have remained stable, reflecting efficient cost management and operational effectiveness.
2. Profit Margins :
- Operating profit margins (OPM) have ranged from 9% to 18% over the years, with a recent OPM of around 13.81%.
- Net profit margins are reported at approximately 12.46%.
3. Earnings Per Share (EPS) :
- The EPS has been fluctuating, but shows an overall positive trend, with significant growth in recent years. For example, the EPS was ₹205 for FY 2023.
4. Return on Equity (ROE) :
- The ROE has been stable at around 17% over the past 10 years, with a slight increase to 19% in the last year.
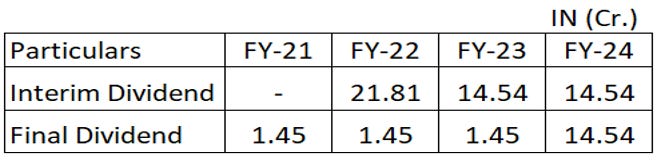
5. Dividend Payout :
- The company has consistently paid dividends, with a recent payout ratio of around 1.45%.
6. Growth Rates :
- Compounded sales growth over 3 years is reported at 22%, while the compounded profit growth is at 23% over the same period.
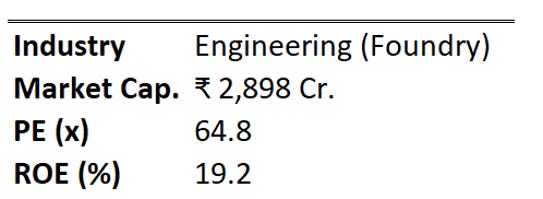
7. Market Cap and Valuation :
- As of August 2024, DISA India has a market capitalization of approximately ₹2,935 crore, with a P/E ratio of 68.44 times and a P/B ratio of 11.93 times, indicating a premium valuation compared to peers.
Financials Of the Company
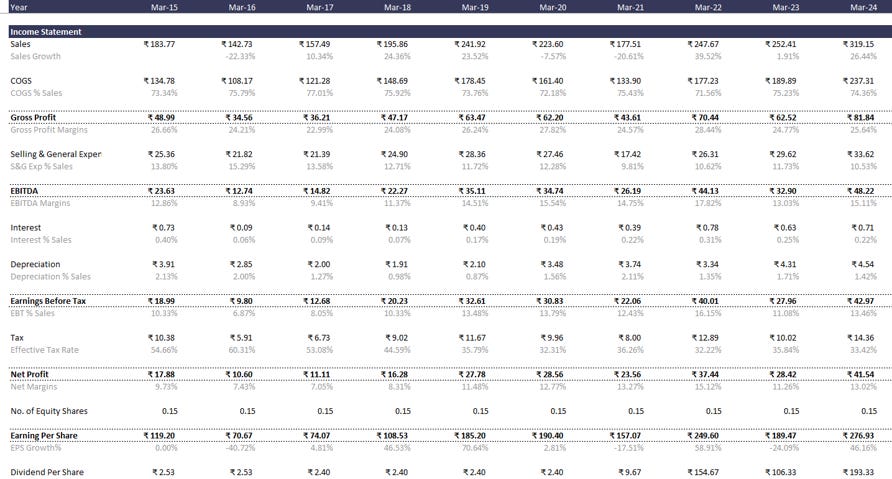
Income Statement
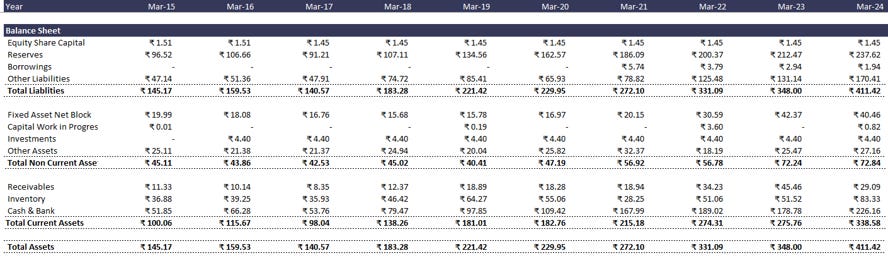
Balance Sheet
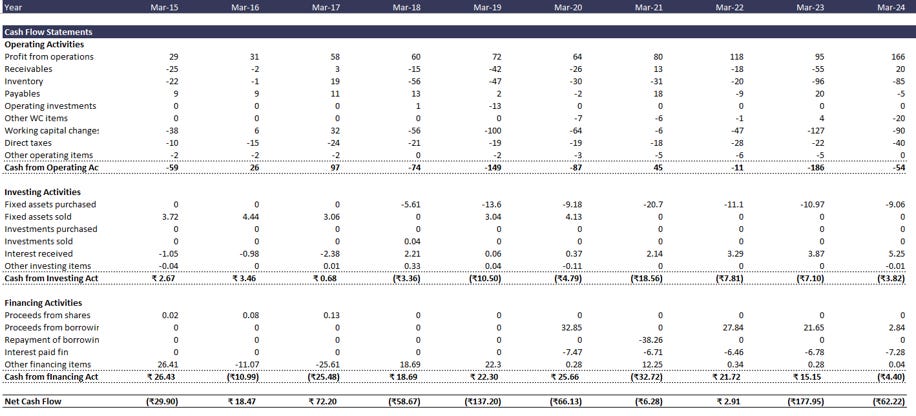
Cash Flow Statement
Growth & Margins
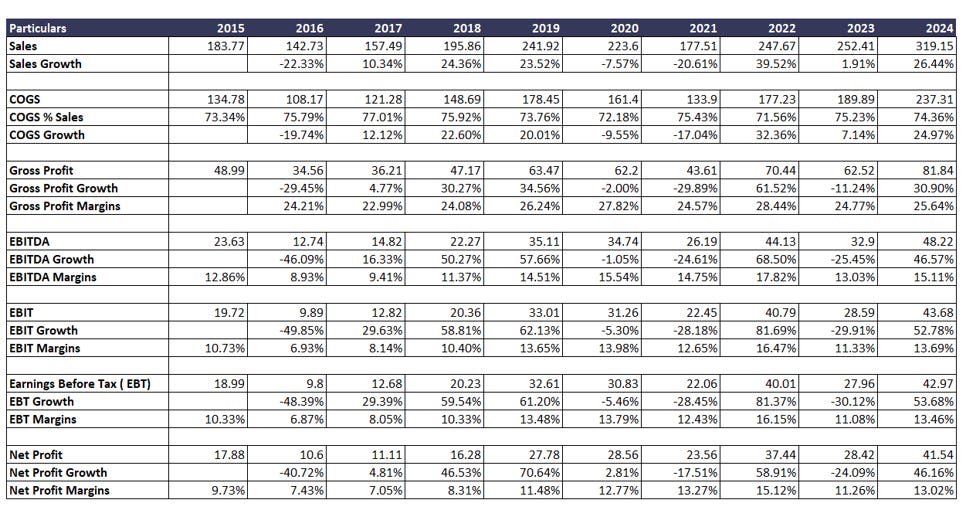
Sales Growth:
Sales have shown significant growth over the years, with some fluctuations.
There was a decline in 2016 and 2020, but subsequent years saw strong recovery and growth.
Cost of Goods Sold (COGS):
COGS has generally increased over the years, but the percentage of COGS to sales (COGS%) has fluctuated.
There was a slight decrease in COGS% from 2019 to 2021, indicating improved efficiency.
Gross Profit and Gross Profit Margin:
Gross profit has shown substantial growth, especially in the latter years.
Gross profit margin has also increased, indicating better pricing or cost control.
Operating Expenses (EBITDA, EBIT):
EBITDA and EBIT have grown significantly, reflecting improved operational efficiency and profitability.
EBITDA and EBIT margins have also increased, indicating better cost management.
Net Profit and Net Profit Margin:
Net profit has grown considerably, with some fluctuations.
Net profit margin has shown an upward trend, indicating improved overall profitability.
DU PONT Analysis
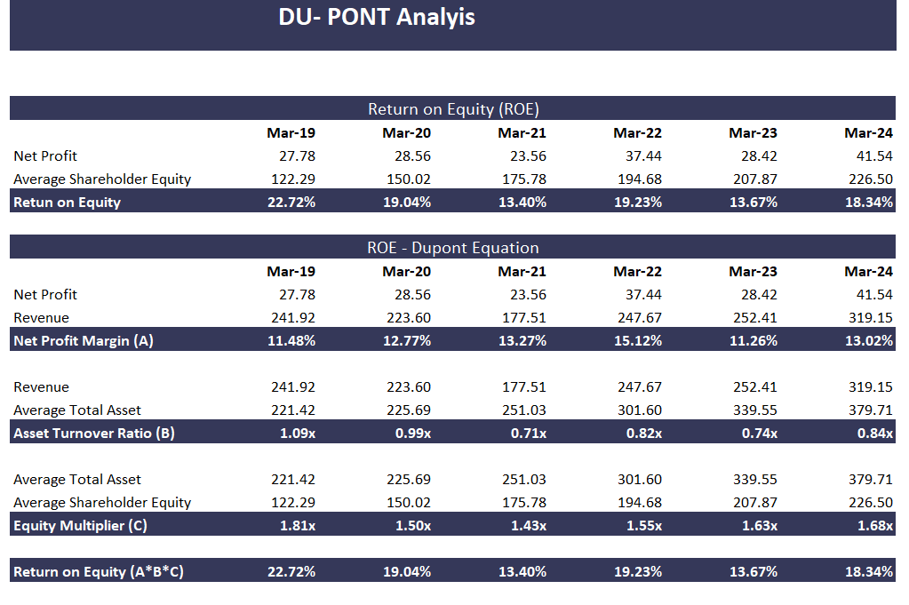
Return on Equity (ROE):
ROE has fluctuated over the analyzed period, with peaks in Mar-19 and Mar-22.
There was a significant decline in ROE from Mar-20 to Mar-21, followed by a recovery.
Net Profit Margin (A):
Net Profit Margin has shown some fluctuations but generally improved over the period.
The peak was in Mar-22, followed by a decline in Mar-23, and a slight recovery in Mar-24.
Asset Turnover Ratio (B):
Asset Turnover Ratio has generally declined over the period, indicating decreasing efficiency in asset utilization.
There was a significant drop from Mar-19 to Mar-21, followed by a gradual improvement.
Equity Multiplier (C):
Equity Multiplier has generally increased over the period, indicating increased financial leverage.
This suggests the company has relied more on debt to finance its assets.
Implications
The decline in ROE from Mar-20 to Mar-21 was primarily driven by a decrease in Asset Turnover Ratio, indicating inefficiency in asset utilization.
The improvement in ROE in Mar-22 was due to an increase in both Net Profit Margin and Asset Turnover Ratio.
The company has increased its financial leverage over the years, which can amplify both profits and losses.
The company has improved its profitability as evidenced by the increasing net profit margin.
However, the low asset turnover ratio suggests inefficient asset utilization. Improving this ratio would have a substantial impact on ROE.
Dividend History
Shareholding Pattern
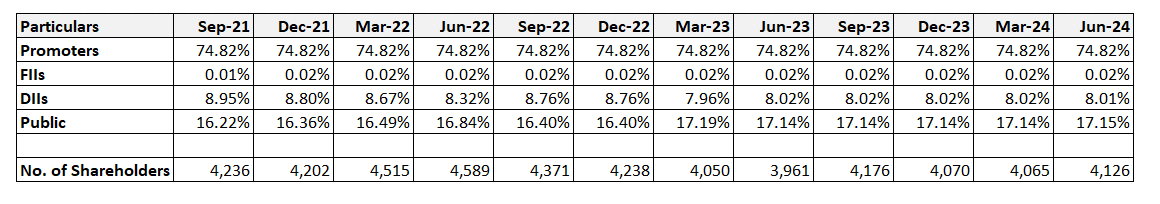
Promoter Dominance: Promoters hold a substantial and consistent 74.82% of the company's shares throughout the analyzed period, indicating strong control.
Stable FII and DII Holdings: The shareholding of FIIs and DIIs has remained relatively stable with minimal fluctuations, suggesting consistent investor interest.
Increasing Public Shareholding: The public's shareholding has shown a gradual increase, particularly from March 2023 onwards. This could indicate growing investor confidence in the company.
Fluctuating Shareholder Base: The number of shareholders has experienced fluctuations, with an overall increase from September 2021 to June 2023, followed by a slight decline in the subsequent quarters.
Implications:
The company's management has a significant controlling stake, which could provide stability and strategic direction.
The consistent interest from institutional investors is a positive sign of the company's financial health and prospects.
The increasing public shareholding suggests growing investor interest and confidence in the company's performance.
The fluctuating number of shareholders might indicate factors such as market conditions, investor sentiment, or corporate actions.
Indian foundry industry future outlook –
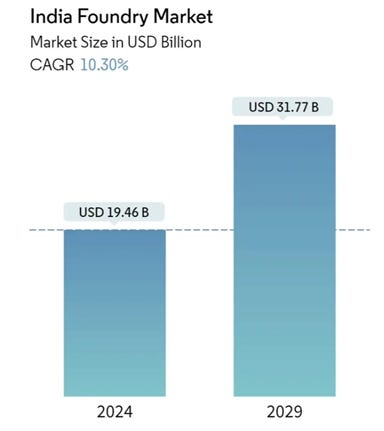
India Foundry Market Analysis –
The India Foundry Market size is estimated at USD 19.46 billion in 2024, and is expected to reach USD 31.77 billion by 2029, growing at a CAGR of 10.30% during the forecast period (2024-2029).During the COVID-19 pandemic in December 2020, more than 400 small foundries in Coimbatore shut their doors due to rising raw material prices. The shutdown affected lakhs of employees working in and with the foundries, as well as in other industries such as pumps, textile machines, automobiles, and other engineering sectors. Moreover, in March 2022, several foundry units in Kolhapur were temporarily closed and declared three to four days of holiday for their employees due to a sharp increase in raw material prices caused by the Russia-Ukraine war.
The major foundry clusters in India are located in Batala, Jalandhar, Ludhiana, Agra, Pune, Kolhapur, Sholapur, Rajkot, Mumbai, Ahmedabad, Belgaum, Coimbatore, Chennai, Hyderabad, Howrah, Kolkata, Indore, Faridabad, and Gurgaon. Typically, each foundry cluster is known for catering to some specific end-use markets. For example, the Coimbatore cluster is famous for pump-set castings, the Kolhapur and Belgaum clusters for automotive castings, the Rajkot cluster for diesel engine castings, and the Howrah cluster for sanitary castings. The IIF estimates suggest that there are over 7,000 foundry units in the country, with about 3,000 located in Gujarat. The sector provides direct employment to about five lakh people and indirect employment to 15 lakh people.
Moreover, the focus on technology upgrades notably drives the growth of the Indian foundry market. For instance, in India, many foundries use cupolas using LAM Coke. However, these are gradually shifting to Induction Melting. There is growing awareness about the environment, and many foundries are switching over to induction furnaces, while some units in Agra are changing over to cokeless cupolas. However, the major challenges faced in India include a lack of skilled manpower, adequate power supply at competitive rates, availability due to mining and environmental issues, and the short-term slowdown in demand, which may hinder medium and longer-term investments.
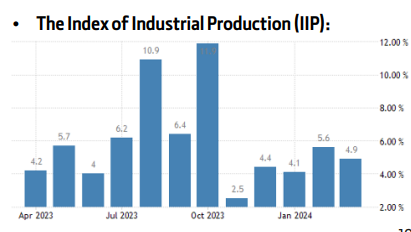
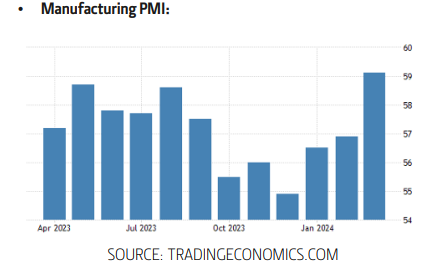
The growth prospects for the financial year 2024-25 continue to be positive at 6.5 to 7%, making the country the fastest-growing large economy in the world. Although the visible signs do not portend a downturn, the company under the backdrop of geopolitical problems around the world adopts a cautious growth direction. The movements of IIP and PMI were considered historically sure indicators of business sentiments in capital goods order intake and are generally watched keenly to get the feel of the pulse of the market.
Source: https://www.mordorintelligence.com/industry-reports/india-foundry-market
India Foundry Market Trends –
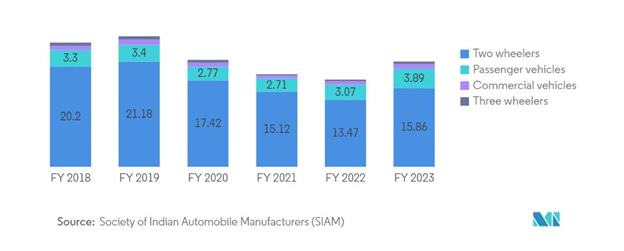
The growing Automobile Sector is Driving the Foundry Market in India
• The Indian foundry market is primarily driven by rapid industrialization and urbanization, which have increased the utilization of the metal casting process across the country. The surge in automobile manufacturing is also a significant factor boosting market growth.
• India stood as one of the world’s leading countries in vehicle production. In the financial year 2023, the total vehicle production in India reached around 25.93 million units, marking an increase from the previous year, as reported by the Society of Indian Automobile Manufacturers (SIAM). In 2020, the production value experienced a contraction primarily due to the introduction of the new Bharat Stage VI (BS-VI) emissions standards on April 1, 2020, and an overall scaled-down production due to the lower stock of the old BS-IV vehicles. The coronavirus pandemic in India further exacerbated the subsequent decline in production.
• According to the Society of Indian Automobile Manufacturers (SIAM), in 2022, India produced approximately 22.93 million vehicles, encompassing commercial vehicles, passenger cars, tricycles, and two-wheelers. The automotive industry experienced a 13.63% growth in sales in 2022 compared to 2021. Specifically, motorcycle sales increased by 4.7% in 2022 over the previous year, according to SIAM.
• Another significant driver for the Indian foundry market’s growth is the increasing government expenditure on infrastructure expansion, stimulating demand for various machinery and equipment such as pumps, cranes, fans, motors, and conveyor belts. This surge in demand, in turn, amplifies the need for metal castings.
• Consequently, there is an escalated demand for auto parts necessary for automobile manufacturing. To address this growing demand for metal castings in India, foundries are investing in new technology and equipment. The anticipated benefits from these investments include lower power consumption, improved production efficiency, higher utilization rates, and increased profit margins for Indian foundries. Therefore, the burgeoning automobile industry is expected to drive the growth of the Indian foundry market during the forecast period.
India Foundry Industry Overview –
The report covers major players operating in the India Foundry Market. The market is highly fragmented and competitive, with large companies claiming significant market share.
Some of the strong players in the country include A Cast Foundry, Aditya Birla Management Corp. Pvt. Ltd., JSW STEEL Ltd., Larsen and Toubro Ltd., Brakes India Pvt. Ltd., Ashok Iron Works Pvt. Ltd., Menon and Menod Ltd., Nelcast Ltd., Tata Sons Pvt. Ltd., CALMET, Cooper Corp. Pvt. Ltd., DCM Ltd., Electrosteel Castings Ltd., Fortune Foundries Pvt. Ltd., Gujarat Metal Cast Industries Pvt. Ltd., etc.,
Major players in the market are implementing various strategies, such as strategic alliances, partnerships, mergers and acquisitions, geographical expansion, and product/service launches, to remain competitive in the market. For instance, in June 2022, Brakes India and Volvo Group ventured into producing green iron castings at Brakes India’s foundries to reduce their carbon footprint.
Source – mordonintelligence report
Challenges in the Indian foundry industry –
Environmental Rules and Regulations:
Foundries must follow strict rules to protect the environment. However, meeting these rules can be complicated and costly, especially for small foundries. The authorities running those foundries are very careful about taking adequate measures to overcome the challenges. They follow all the recommendations that are necessary for maintaining environmental or ecological integrity.
Use of Old Technology:
Many foundries still use old technology. This makes them less efficient and can affect the quality of what they make. Upgrading to new technology can help, but it can be expensive. Here, the role of the best manufacturers of these technologies becomes very significant. They can help the foundries with the latest machines. Their contribution can help every Cast Iron Foundry in India. Ultimately, it can benefit cast iron mold manufacturers in USA also.
Competition from Imports:
Foundries in India have to compete with imported castings that are often cheaper. This puts pressure on them to lower prices, which affects their profits. To stay competitive, they need to focus on making high-quality products efficiently. Top foundries are doing well in this direction by collaborating with better service providers.
Lack Of Skilled Workforce:
It’s tough for foundries to find skilled workers, especially in fields like metallurgy. This means they have to spend more on training, which can also affect the quality of what they make. The relentless efforts of these foundries are easing the situation for them. It is likely to get better in the time to come as well.
Problems with Raw Materials:
The cost and availability of materials like iron ore can change a lot. This can make it hard for foundries to make money. Finding new sources of materials can help. It is a challenging and time-consuming task. However, the government in India is looking into the matter. The authorities at the leading Cast Iron Foundries in India are hopeful to sort out this challenge sooner or later.
Source – GPCL group report
India Foundry Market Leaders –
1.A Cast Foundry
2.JSW Group
3. Aditya Birla Management Corporation Private Limited (ABMCPL)
4.Brakes India Pvt. Ltd.
5.Larsen & Toubro Ltd
Recent News about the company –
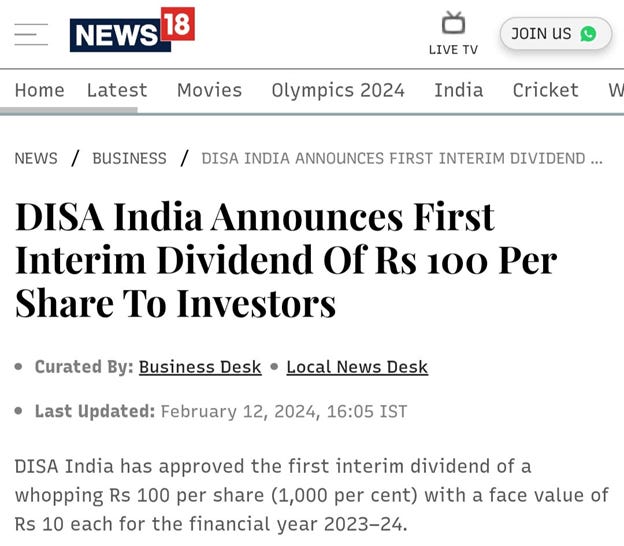
Source – News18
Thank you for reading till the end! I hope you enjoyed this report.
Researched By- Naresh and Mayank
Prepared By- Naresh
All information is sourced from company annual reports, screener.in, industry reports, and various news publications.
Disclaimer- We do not recommend buying or selling any stock, nor are we SEBI-registered research analysts. You should consult your financial advisor before buying or selling any financial instrument.