


Declining trend in the NPAs

First of all, what are NPAs?
Here is my article link to NPAs
Decoding Non-Performing Assets (NPAs): Understanding, Management, and Regulatory Oversight

Understanding Non-Performing Assets (NPAs) Non-Performing Assets (NPAs) are assets that fail to generate economic value or benefit for a business. While this may seem straightforward, let's delve deeper to understand the complexities involved. Defining Assets:
You will then be able to understand this Article.
Now, I’m assuming you have read the article, now let's just start it.
Introduction to NPAs and Banking Stability in India
In the new RBI Financial Stability Report dated June 27, 2024, we uncover crucial data about the overall strength of India's banking sector. This analysis delves into the declining trends in Gross Non-Performing Assets (NPAs), slippage ratios, profitability metrics, and the stability of Non-Financial Companies (NFCs) within the country.
Our discussion will provide insights into:
1. Declining Gross NPAs: Explore the significant reduction in Gross NPAs across public and private sector banks and understand the underlying reasons behind this positive trend.
2. Slippage Ratios: Understand the trends in slippage ratios and how banks have managed to control the addition of new NPAs.
3. Profitability Growth: Analyze the upward trends in Return on Assets (RoA) and Return on Equity (RoE), indicating improved efficiency and profitability within banks.
4. Stability in Non-Financial Companies: Examine the debt-equity ratios, total debt trends, and how India compares to other countries in terms of corporate debt.
By the end of this overview, you'll gain a comprehensive understanding of how India's banking sector has achieved financial stability and what it means for the future. Dive into the full analysis to see how these factors are shaping the country's economic landscape.
Declining Gross NPAs
Source- RBI
Analysis of the Gross Non-Performing Assets (NPA) Ratio
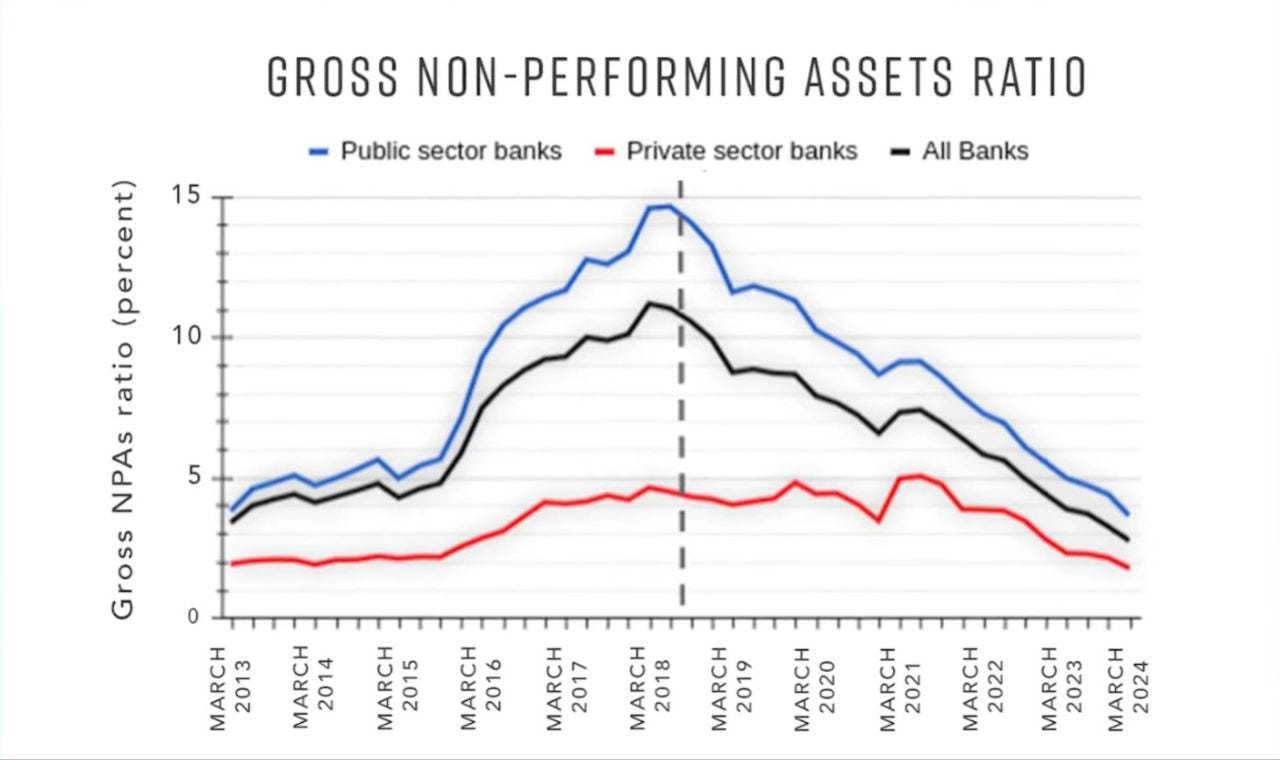
The image shows a graph of the Gross NPA ratio for public sector banks, private sector banks, and all banks over the period from March 2013 to March 2024.
1. Public Sector Banks (Blue Line)
- Trend: The NPA ratio for public sector banks started around 5% in March 2013, rising sharply to a peak of around 14% in March 2018. After 2018, the ratio shows a significant downward trend, dropping to approximately 3.8% by March 2024.
- Key Observations:
- There is a sharp increase from 2013 to 2018, indicating a period of high financial stress and loan defaults in public sector banks.
- Post-2018, the significant decline suggests improved asset quality, better recovery processes, or stricter lending practices.
2. Private Sector Banks (Red Line)
- Trend: The NPA ratio for private sector banks remains relatively low, starting at around 2% in March 2013 and peaking at around 4% in March 2018. The ratio then declines to below 2% by March 2024.
- Key Observations:
- Private sector banks consistently have a lower NPA ratio compared to public sector banks.
- The peak in 2018 is much less pronounced, and the decline is more gradual, indicating more stable asset quality and potentially better risk management practices in private sector banks.
3. All Banks (Black Line)
- Trend: The NPA ratio for all banks follows a similar pattern to that of public sector banks, starting at around 4% in March 2013, peaking at around 11% in March 2018, and then declining to about 3% by March 2024.
- Key Observations:
- The overall trend is influenced more by public sector banks due to their larger market share.
- The decline post-2018 indicates an overall improvement in the banking sector’s asset quality.
Overall Analysis
- Peaks and Declines:
- The peak in NPAs around 2018 across all categories suggests a period of widespread financial stress, possibly due to economic downturns, poor lending practices, or other macroeconomic factors.
- The subsequent decline suggests effective measures were taken post-2018 to address the issue, such as stricter NPA recognition norms, improved recovery processes, and better credit appraisal systems.
- Public vs. Private Sector:
- Public sector banks faced higher levels of NPAs compared to private sector banks, indicating possible issues with risk management, lending practices, or exposure to riskier sectors.
- The recovery in public sector banks is sharper post-2018, which might be due to government interventions, recapitalization, and stricter regulatory oversight.
- Current State:
- As of March 2024, both public and private sector banks show improved NPA ratios, indicating a healthier banking sector.
- The decline in NPAs is a positive indicator of financial stability, better asset quality, and effective management of non-performing loans.
This analysis highlights the importance of effective risk management practices, regulatory oversight, and timely interventions to maintain the health of the banking sector.
How are they performing so well now?
The big answer to this is “slippage”
A slippage occurs when a bank's loan becomes a non-performing asset (NPA) on account of the borrower not paying interest for over 90 days. Any addition of NPAs during the year is called slippage.

The graph displays the half-yearly slippage ratio for different categories of banks, namely Public Sector Banks (PSBs), Private Sector Banks (PVBs), Foreign Banks (FBs), and all Scheduled Commercial Banks (SCBs), over several periods: September 2022, March 2023, September 2023, and March 2024.
Analysis:
1. Public Sector Banks (PSBs):
- Mar-24: The slippage ratio remains stable at 0.5%.
Trend: A noticeable decrease from Sep-22 to Mar-23, followed by a stable trend.
2. Private Sector Banks (PVBs):
Mar-24: The slippage ratio decreases slightly to 0.5%.
Trend: A consistent decrease over the periods, indicating improved asset quality or better credit management.
3. Foreign Banks (FBs):
Mar-24: The slippage ratio remains at 0.2%.
Trend: A steady decrease over time, reflecting very low levels of new NPAs.
4. All Scheduled Commercial Banks (SCBs):
Trend: General decreasing trend from Sep-22 to Sep-23, followed by a slight increase by Mar-24.
Overall Insights:
- General Improvement: Most bank categories show a decreasing trend in slippage ratios over the observed periods, indicating a general improvement in asset quality.
- Exception for SCBs: The slight increase in the slippage ratio for SCBs from Sep-23 to Mar-24 could be a point of concern, suggesting a possible rise in new non-performing assets (NPAs) or other underlying issues.
- Comparative Analysis: Foreign Banks (FBs) consistently maintain the lowest slippage ratios, suggesting better credit risk management compared to other bank categories. Public Sector Banks (PSBs) also show significant improvement but have higher ratios compared to FBs.
In conclusion, the graph reflects an overall positive trend in reducing slippage ratios.
Second, The bank’s overall profitability has shown good growth
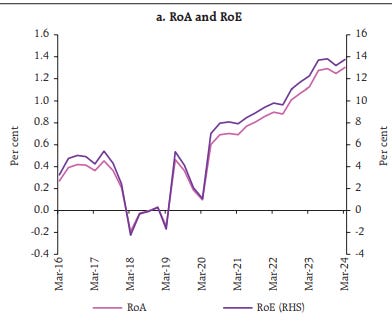
The graph with two lines representing Return on Assets (RoA) and Return on Equity (RoE) over a period from March 2016 to March 2024.
1. RoA (Return on Assets):
- The RoA started at around 0.6% in March 2016.
- It experienced fluctuations with a noticeable dip around March 2019.
- Post-March 2020, RoA shows a consistent upward trend, peaking at around 1.4% by March 2024.
2. RoE (Return on Equity):
- RoE started at approximately 8% in March 2016.
- Similar to RoA, RoE dips around March 2019, reaching a low point.
- From March 2020 onwards, RoE increases steadily, reaching around 14% by March 2024.
- Initial Period (2016-2019): Both RoA and RoE show volatility with noticeable dips around March 2019.
- Post-2019 Recovery: Starting from March 2020, there is a significant and steady improvement in both RoA and RoE. This suggests enhanced efficiency and profitability.
- Long-Term Trend: Over the long term (2016-2024), the general trend for both RoA and RoE is upward, indicating positive growth and improved financial performance.
Third, Stability in the NFC - Nonfinancial Companies
NFCs are companies that are not involved in the core operations of financial activities or could be said the primary business is not financial activities.
To measure this stability here are some indicators.
Debt-Equity ratio
Total debt taken
Debt Comparison of NFC to other countries.

1. Debt-Equity Ratio (a)
- Y-Axis (Ratio): This represents the debt-equity ratio, a measure of a company's financial leverage calculated by dividing its total liabilities by stockholders' equity.
- X-Axis (Time): The time period spans from 2000-01 to 2022-23.
Observations:
- The debt-equity ratio started around 1.4 in 2000-01.
- There is a general downward trend with fluctuations, reaching a low point below 0.9 around 2012-13.
- Post-2012-13, the ratio shows some recovery, peaking again at around 1.2 in 2016-17.
- From 2016-17 onwards, the ratio declined significantly, reaching a low of approximately 0.8 in 2022-23.
Analysis:
- The decreasing trend suggests that companies have been reducing their leverage over time.
- The fluctuations indicate periods of increased borrowing or equity changes.
- The recent decline suggests stronger equity positions or reduced borrowing, indicating a potentially less risky financial position.
2. India NFC Debt (b)
- Y-Axis (Percent of GDP): This measures the non-financial corporate (NFC) debt as a percentage of India's GDP.
- X-Axis (Time): The time period spans from 2007 to 2023.
Observations:
- The NFC debt as a percentage of GDP was around 55% in 2007.
- It rose sharply, peaking at over 70% around 2014.
- Post-2014, there is a gradual decline with fluctuations, reaching approximately 60.7% in 2023.
Analysis:
- The initial rise indicates increased borrowing by non-financial companies, possibly for expansion or operational needs.
- The peak and subsequent decline suggest efforts to reduce debt levels relative to GDP.
3. NFC Debt - Comparison (c)
- Y-Axis (Percent of GDP): This measures NFC debt as a percentage of GDP for different countries/regions.
- X-Axis (Countries/Regions): The comparison includes China, Japan, Emerging Markets (EM), European Union (EU), Advanced Economies (AE), United States (US), United Kingdom (UK), and India.
Observations:
- China has the highest NFC debt at 138.3% of GDP.
- Japan follows with 114.8%, and EM, EU, AE, and US have NFC debts ranging from 97.7% to 88.8%.
- The UK has a lower NFC debt at 64.2%.
- India has the lowest NFC debt among the compared regions at 60.7%.
Analysis:
- India’s lower NFC debt relative to GDP suggests more conservative borrowing practices compared to other major economies.
- High NFC debt in countries like China and Japan could indicate higher corporate leverage, potentially increasing financial vulnerability.
- The comparison shows India's corporate sector is less leveraged, which could be seen as a positive indicator of financial stability, though it might also indicate less aggressive expansion.
Overall Analysis:
- The debt-equity ratio and NFC debt trends for India suggest a conservative approach towards borrowing and leveraging.
- Compared to other major economies, India's non-financial corporate debt is relatively low, indicating a potentially lower risk profile for the corporate sector.
- The trends reflect efforts towards financial stability and reduced reliance on debt, which can be positive for long-term economic health.