

Can We Trust GDP?
The IMF's review of India's national accounts isn't about whether the economy is growing it's about whether we're measuring that growth correctly.

A seemingly technical headline recently made its way into the financial pages: the International Monetary Fund (IMF) will reassess India’s national accounts later this year after the release of GDP estimates based on the new 2022–23 base year. The review follows the IMF’s ‘C’ rating of India’s national accounts in November 2025, which pointed to methodological weaknesses such as an outdated 2011–12 base year, heavy reliance on the Wholesale Price Index (WPI) for deflation, and the extensive use of single deflation in manufacturing.
Since then, India has responded with one of its biggest statistical overhauls in decades updating the base year to 2022–23, introducing double deflation for manufacturing, expanding item-level deflators, and making greater use of administrative and digital data. But why does any of this matter?
Because this is not just a debate about statistics it is a debate about credibility. GDP numbers influence everything from government budgets and RBI policy decisions to foreign investment, sovereign credit ratings, and global perceptions of India’s economic strength.

If the measuring system itself is questioned, confidence in the numbers inevitably comes under scrutiny. Yet before we discuss why the IMF reviews national accounts, why India received a ‘C’ rating, or what the recent reforms aim to fix, we need to answer a more fundamental question that surprisingly few people ask: What exactly are national accounts, and how is GDP actually measured? That is precisely what this article explores.
What Are National Accounts? The Economy’s Bookkeeping System
National accounts are often introduced through a collection of intimidating abbreviations GDP, GVA, GNI, NDP, NI as though economists secretly compete to invent new acronyms every decade. Fortunately, the underlying ideas are far simpler than the terminology suggests.
Gross Value Added (GVA)
Imagine a large automobile factory.
Iron ore enters one end of the plant. It is transformed into steel, steel becomes car frames, engines are assembled, electronics are installed, the car is painted, tested, and finally driven out of the factory gate as a finished vehicle.
At every stage, value is being created.
The workers assembling engines contribute value. The engineers designing software contribute value. Even the logistics company transporting components contributes value.
Economists call this Gross Value Added (GVA).
GVA measures the additional value created at each stage of production after subtracting the cost of intermediate inputs. In simple terms, it asks one question: “How much new value did this producer actually create?” If a furniture manufacturer purchases ₹10 lakh worth of timber and sells finished furniture worth ₹16 lakh, it has not created ₹16 lakh of new economic value. It has created ₹6 lakh. The remaining ₹10 lakh already existed in the form of timber.
Now zoom out from the factory to the entire country.
If we add together the value created by every farmer, software company, hospital, factory, consultant, restaurant, airline, retailer and manufacturer across India, we arrive at the country’s total Gross Value Added.
But governments also collect indirect taxes such as GST while providing subsidies on certain products. Since consumers ultimately pay prices that include taxes and exclude subsidies, national accountants adjust for these differences.
Gross Domestic Product (GDP)
This brings us to Gross Domestic Product (GDP).
Mathematically, GDP is simply:
GDP = GVA + Product Taxes – Product Subsidies
Although the formula looks intimidating, the intuition is straightforward. GDP measures the total market value of all final goods and services produced within a country’s geographical boundaries, irrespective of who owns the businesses producing them.
That last phrase is surprisingly important.
Suppose a Japanese automobile company manufactures cars in Chennai. The factory is physically located in India, employs Indian workers, buys inputs from Indian suppliers, and contributes to India’s production. Its output therefore becomes part of India’s GDP.
Why GDP Is an Estimate, Not a Direct Measurement
At this point, a natural question arises.
If national accounts are so carefully designed, why can’t statisticians simply count everything?
The answer lies in the sheer scale and complexity of a modern economy.
Every single day, billions of economic decisions unfold simultaneously.
A software engineer invoices an overseas client. A farmer sells vegetables in a village market. A café serves hundreds of customers. A YouTuber earns advertising revenue. A taxi driver completes dozens of rides. A lawyer drafts contracts. A startup raises venture capital. A neighbourhood tailor alters school uniforms. An AI model generates business reports in seconds.
Trying to record every one of these activities in real time would be like attempting to count every drop of water flowing through the Ganga. By the time you’ve finished counting one section, millions of new drops have already passed by.
The administrative cost would be astronomical, and the exercise would never actually end. That is why GDP is fundamentally an estimate, not a physical count.
Instead of observing every transaction individually, statistical agencies piece together the economy using multiple sources of information tax filings, corporate financial statements, household expenditure surveys, agricultural estimates, industrial production data, customs records, labour force surveys, banking information and government accounts.
No single dataset is sufficient. Each captures only one slice of economic reality.
To ensure the estimates remain credible, economists approach the same economy from three different directions, almost like triangulating the location of a mountain using three separate maps.
The production approach asks: How much value was created?
The income approach asks: Who earned that value?
The expenditure approach asks: Who spent on the final output?
In theory, all three methods should converge on the same GDP because every product produced is simultaneously someone’s income and eventually someone’s expenditure.
The economy, after all, does not create value three times. It merely allows us to observe the same activity from three different perspectives.
When the numbers align, confidence in the estimates increases. When they diverge, statisticians investigate the discrepancies, revise assumptions and improve their models.
National accounting is therefore less about counting perfectly than about ensuring that multiple imperfect measurements consistently point toward the same underlying economic reality.
The Building Blocks of GDP: How Raw Data Becomes Economic Reality
By now, we’ve seen that GDP is not something statisticians simply “count.” It is something they construct.
But how exactly does that construction happen?
Behind a single headline number lies an enormous amount of statistical engineering. Economists must decide which prices to use, how to remove inflation, how to compare today’s economy with one from a decade ago, how to account for seasonal fluctuations, and how to revise estimates as better information becomes available.
The final GDP figure may look like a single number.
In reality, it is the outcome of hundreds of methodological decisions working together behind the scenes.
Understanding a few of these building blocks makes it much easier to appreciate why GDP numbers sometimes change even when the economy itself hasn’t.
The Base Year: Choosing the Economy’s Reference Point
Imagine measuring how much a child has grown. The first thing you need is a starting point. Without knowing where the child began, saying they “grew by 20 centimetres” tells us very little. GDP measurement works in much the same way. Economists need a reference year known as the base year against which future economic output can be compared.
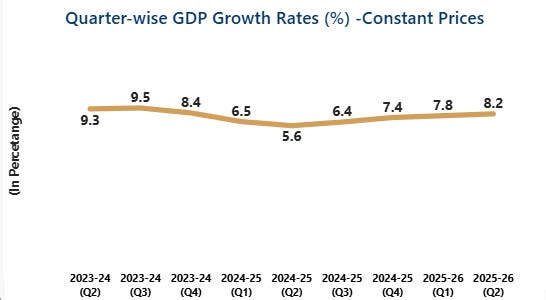
Base Year- 2011-12
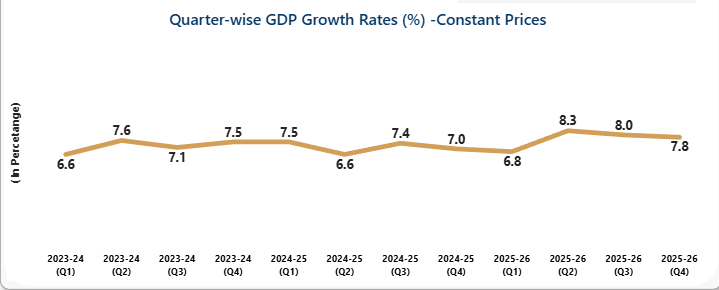
Base Year- 2022-23
The base year acts as the benchmark for calculating real GDP, removing the effects of inflation. In the base year itself, nominal GDP and real GDP are identical because current prices and base-year prices are the same.
As years pass, however, the prices from the base year continue to be used as weights to measure physical growth. This helps economists separate changes in prices from changes in actual production.
For example, if wheat prices double because of poor rainfall, it does not mean the country produced twice as much wheat. Similarly, cheaper smartphones due to technological advances do not imply lower production. But economies constantly evolve.
New industries such as cloud computing, digital payments, and artificial intelligence become increasingly important, while older sectors change in relative significance. If the base year is not updated regularly, it begins to reflect yesterday’s economy rather than today’s, making growth estimates progressively less representative of economic reality.
Nominal GDP and Real GDP: Same Economy, Different Questions
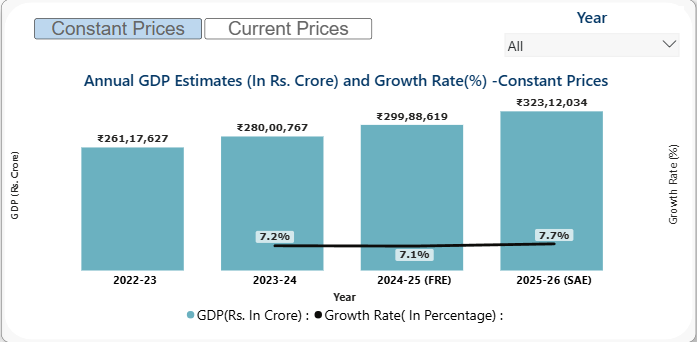
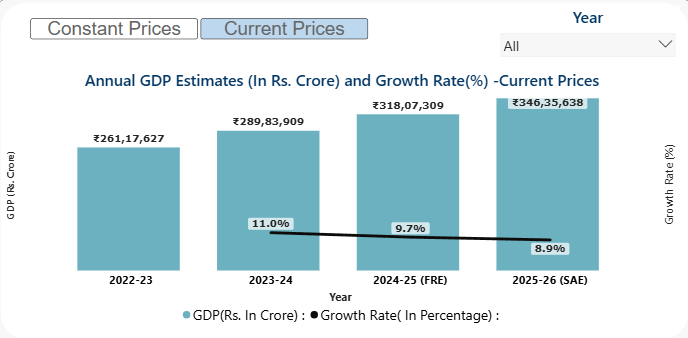
One of the most common sources of confusion in economics is the difference between nominal GDP and real GDP, but the idea is quite simple. Imagine a neighbourhood bakery that sold 1,000 loaves of bread last year at ₹40 each and the same 1,000 loaves this year at ₹50 each. The bakery's revenue has increased, but its production has not it sold exactly the same number of loaves.
Nominal GDP captures this increase because it values output using current market prices, answering the question: "How much was today's production worth at today's prices?" Real GDP, on the other hand, values the same output using base-year prices, asking: "Ignoring inflation, did we actually produce more?" This distinction is crucial because policymakers are interested in genuine economic expansion, not merely rising prices.
A country whose GDP grows by 10% solely because prices increased by 10% is in a very different position from one whose GDP grows by 10% because it actually produced 10% more goods and services. One reflects inflation, while the other reflects real economic growth.
The GDP Deflator: Measuring Inflation for the Entire Economy
Once economists separate changes in prices from changes in production, they need a measure of inflation that reflects the entire economy, not just household spending.
While the Consumer Price Index (CPI) tracks the prices consumers pay for a fixed basket of everyday goods and services, GDP includes much more than consumption it also covers business investment, government expenditure, exports, infrastructure projects, and other forms of production. This is why economists use the GDP deflator, which measures price changes across all domestically produced goods and services.
Unlike the CPI's relatively fixed basket, the GDP deflator automatically adjusts as the economy evolves. For example, if software becomes a larger part of the economy while agriculture's share declines, the GDP deflator reflects that changing composition.
In simple terms, the CPI asks, "How much more expensive has life become for households?" whereas the GDP deflator asks, "How much have prices changed across everything the economy produces?" The two are closely related, but they measure different aspects of inflation.
Why the IMF Cares About Your GDP Numbers More Than You Might Think
When governments borrow billions of dollars, attract foreign investment, negotiate trade agreements, or issue sovereign bonds, international investors face the same question that banks ask individual borrowers:
Can we trust the numbers?
This is where GDP stops being merely a statistical estimate and becomes an issue of credibility.
After all, if investors are lending money to a country for the next thirty years, they need confidence that the country’s economic statistics genuinely reflect reality. Nobody wants to discover halfway through the loan that the measuring tape was inaccurate.
That is why international institutions devote enormous effort to reviewing how countries compile their national accounts.
These reviews are not about judging whether an economy is “good” or “bad.” They are about asking a much narrower but equally important question:
Is the economy being measured using internationally accepted methods?
The IMF Is Less Like an Examiner and More Like an Auditor
Among the institutions involved in this process, the International Monetary Fund (IMF) plays one of the most visible roles.
Every few years, IMF economists examine a country’s statistical system as part of their broader economic surveillance. They review not only the published GDP figures but also the methods, assumptions and data sources used to produce them.
Think of it less as a school examination and more as an independent audit.
A company’s audited financial statements do not guarantee that the company will be profitable. They simply increase confidence that the reported numbers have been prepared using accepted accounting standards.
The IMF performs a similar function for national statistics.
Its objective is not to calculate India’s GDP independently but to assess whether India’s statistical machinery follows internationally recognised best practices.
This distinction is important because discussions around IMF assessments are often unnecessarily sensationalised.
India’s Recent Review: A Story of Methodology, Not Manipulation
This became particularly evident when the IMF assessed India’s national accounts methodology.
In November 2025, the IMF’s Data Adequacy Assessment assigned India’s national accounts a “C” rating. At first glance, headlines made the assessment sound alarming.
But headlines and statistical methodology rarely enjoy each other’s company.
The rating did not suggest that India’s GDP figures were fabricated or unusable. Instead, it highlighted several technical areas where India’s statistical system had fallen behind evolving international standards.
One concern was the continued use of 2011–12 as the base year, even though India’s economy had changed dramatically over the preceding decade. A digital economy built around UPI, e-commerce, platform work, AI services and formalisation through GST naturally looks very different from the economy of 2011.
Trying to measure today’s India using an old base year is a bit like using a decade-old map to navigate a city where entire neighbourhoods have appeared in the meantime. You may still reach your destination, but the route is unlikely to be the most accurate.
The IMF also noted India’s reliance on the Wholesale Price Index (WPI) for deflating parts of economic output and the extensive use of single deflation in manufacturing.
As we discussed earlier, measuring real growth requires separating changes in quantities from changes in prices. If the methods used to remove inflation are outdated, estimates of real GDP may become less precise, particularly during periods of rapid structural change.
The emphasis, however, was always on improving methodology, not questioning the existence of economic growth itself.
Statistical Systems Must Evolve Alongside Economies
Recognising many of these methodological challenges, India’s Ministry of Statistics and Programme Implementation (MoSPI) introduced significant revisions in 2026. The new series adopted 2022–23 as the base year, updated sectoral weights to better reflect the contemporary economy and introduced double deflation for manufacturing, bringing India’s methodology closer to international best practices.
Following these revisions, Ranil Salgado, the IMF’s Senior Representative for India, indicated in July 2026 that the IMF would reassess India’s national accounts during its next Article IV Consultation.
That is exactly how statistical improvement is supposed to work.
Economies change.
Measurement evolves.
International institutions review the changes.
Statistical agencies refine their methods further.
The process is continuous rather than confrontational.
One could even argue that if an economy is never revising its statistical methods, that is probably more worrying than the revisions themselves.
After all, no smartphone proudly advertises that it has never received a software update.
How Does the IMF Judge Statistical Quality?
To make these assessments systematic rather than subjective, the IMF uses what is known as the Data Quality Assessment Framework (DQAF).
The framework examines whether a country’s statistical architecture is robust enough to support sound policymaking and informed investment decisions.
It asks questions that go far beyond the final GDP number.
Are the country’s statistical agencies professionally independent? Do they follow internationally accepted methodologies? Are the underlying surveys reliable? Are the data released regularly and on time? Can researchers understand how the estimates were produced?
These questions are organised into five broad dimensions.
The first is Integrity whether the statistical agency operates independently, professionally and without undue interference.
The second is Methodological Soundness whether national accounts follow internationally recognised standards such as the System of National Accounts (SNA).
The third is Accuracy and Reliability, which examines the quality of surveys, administrative records and estimation techniques used to construct the data.
The fourth is Serviceability, focusing on whether statistics are timely, internally consistent and regularly updated.
Finally, there is Accessibility, which evaluates whether datasets, documentation and methodological notes are sufficiently transparent for researchers, businesses and policymakers to scrutinise.
Notice something interesting. Very little of this framework asks whether GDP growth is “high” or “low.” Almost all of it asks whether the numbers are credible.
In statistics, trust is often more valuable than precision. A slightly imperfect number that everyone trusts is usually more useful than a theoretically perfect number that nobody believes.
Why Good Statistics Save Countries Money
Good statistics may seem like a concern only for economists and statisticians, but financial markets view them very differently. International investors closely monitor whether countries comply with the IMF's Special Data Dissemination Standard (SDDS) and the more advanced SDDS Plus.
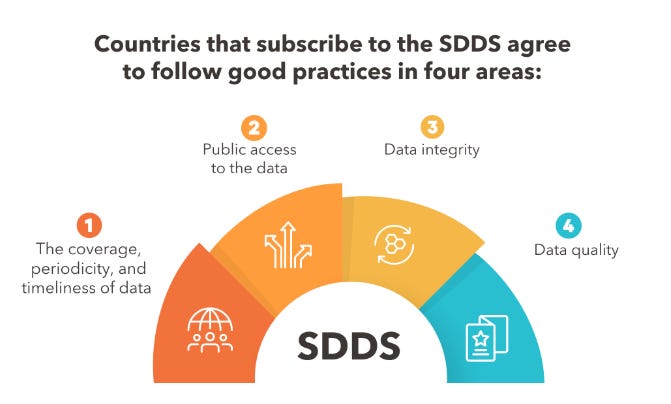
Meeting these standards signals that a country is committed to producing credible and internationally comparable statistics. This has real financial benefits. Multiple IMF studies show that countries improving their statistical transparency often enjoy lower sovereign borrowing costs, as investors demand smaller risk premiums when uncertainty declines.
Better statistics build trust, lower perceived risk, reduce government borrowing costs, and ultimately improve fiscal sustainability. In other words, investing in a strong statistical system is not just about producing better data it can save governments billions of dollars over time by lowering the cost of capital.
The Rulebook Is Changing Because the Economy Is Changing
National accounting is not static it evolves as the economy evolves. For decades, the United Nations System of National Accounts (SNA) has provided the global framework for measuring economic activity.
Today, the world is transitioning from SNA 2008 to the updated SNA 2025, reflecting a fundamental shift in how economic value is created. Earlier versions were designed for economies driven by factories, machines, and physical production, whereas today's economy increasingly depends on software, digital platforms, artificial intelligence, data, intellectual property, ecosystem networks, and intangible capital.
The new framework also gives greater importance to natural resource depletion and environmental sustainability. By expanding the boundaries of national accounts, SNA 2025 aims to better capture the realities of a modern economy.
Ultimately, as economies change, the statistical architecture that measures them must also adapt, because in the twenty-first century, economic strength depends not only on growing faster but also on measuring growth more accurately.
Measuring India Is Harder Than Measuring Almost Any Other Major Economy
Measuring any economy is difficult, but measuring India's economy is uniquely challenging because it is, in many ways, two economies operating side by side.
One India is highly formal and digital it files GST returns, processes UPI payments, maintains digital accounts, raises venture capital, and exports software, leaving behind a rich digital trail.
The other India consists of neighbourhood tailors, roadside vendors, small farmers, family-run workshops, carpenters, transporters, and millions of self-employed workers whose activities often take place outside formal bookkeeping systems.
Both contribute significantly to economic growth, but only one is easy to measure. This duality makes India's national accounts among the most complex statistical exercises in the world. While over 90% of India's workforce is employed in the informal sector, it does not imply that 90% of GDP is informal.
Instead, it highlights the challenge of accurately measuring a large share of economic activity generated by businesses that leave limited formal financial records. The real challenge is not recognizing their contribution, but measuring it accurately.
When You Cannot Observe Everything, You Use Proxies
Imagine trying to estimate how crowded an entire city is by looking at just one traffic camera. If traffic is moving smoothly at that junction, you might assume the whole city is flowing well.
Most of the time, that assumption may be reasonable but if another part of the city is flooded, a bridge has collapsed, or a festival has blocked several roads, that single camera no longer tells the whole story. For many years, India's statistical system faced a similar challenge.
Since large-scale surveys of the unorganised sector were expensive and could not be conducted every year, statisticians relied on the organised sector as a proxy to estimate growth in the intervening years.
The assumption was simple: if registered factories were growing at a certain pace, the informal sector was likely moving in a similar direction. It was a practical approach, but one built on a crucial assumption that the formal and informal economies behaved broadly alike. For many years, this worked reasonably well, until the structure of the Indian economy began to change.
The Great GDP Debate
These measurement challenges eventually spilled into one of the most closely watched debates in Indian macroeconomics.
In March 2026, economists Abhishek Anand, Josh Felman, and Arvind Subramanian published a working paper through the Peterson Institute for International Economics (PIIE) that reignited discussion around India’s post-2011 GDP estimates.
Their argument was not that India’s economy had stopped growing. Nor did they claim that official statistics were fabricated. Their concern was methodological.
The paper suggested that between 2012 and 2023, India’s GDP growth may have been overstated by roughly 1.5 to 2 percentage points annually because official estimates relied too heavily on organised corporate data particularly from the MCA-21 corporate database to infer the performance of the much larger informal sector.
The underlying logic was straightforward. If large registered companies continued performing relatively well while millions of smaller informal enterprises were facing significant stress, using the organised sector as a proxy could paint a more optimistic picture of the overall economy than actually existed.
The paper also highlighted another issue we encountered earlier in this article—the choice of price deflators.
Differences between the Consumer Price Index (CPI) and the Wholesale Price Index (WPI) averaged around 2.2 percentage points annually during this period. Since real GDP depends critically on removing inflation accurately, persistent differences between these indices could influence estimates of real economic growth.
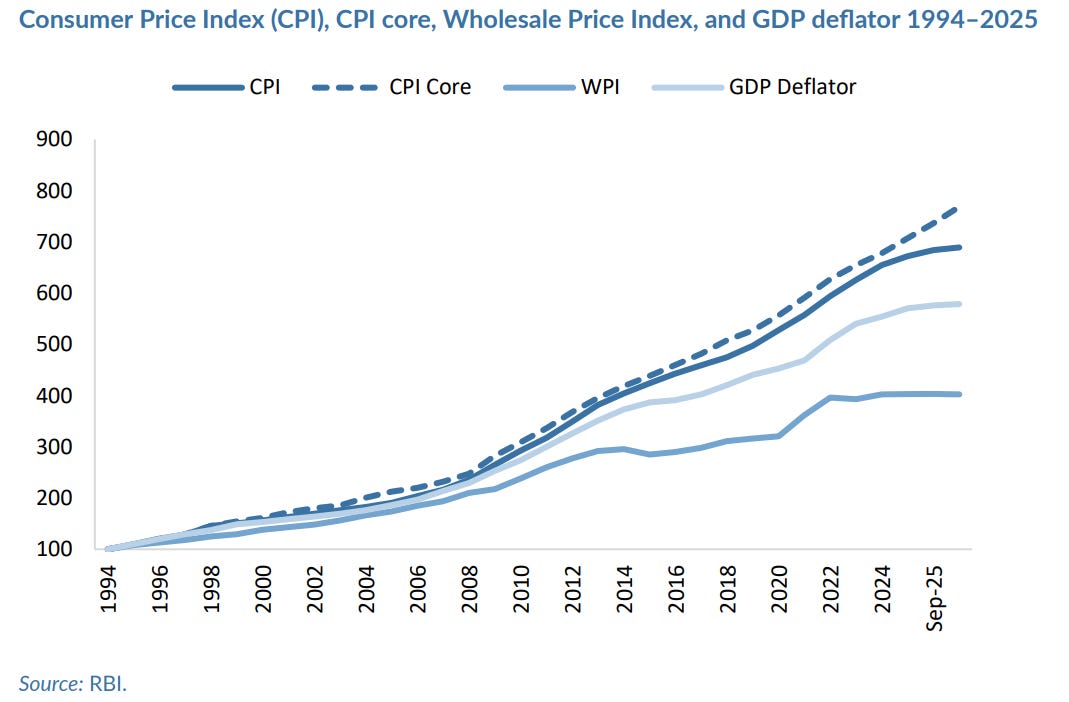
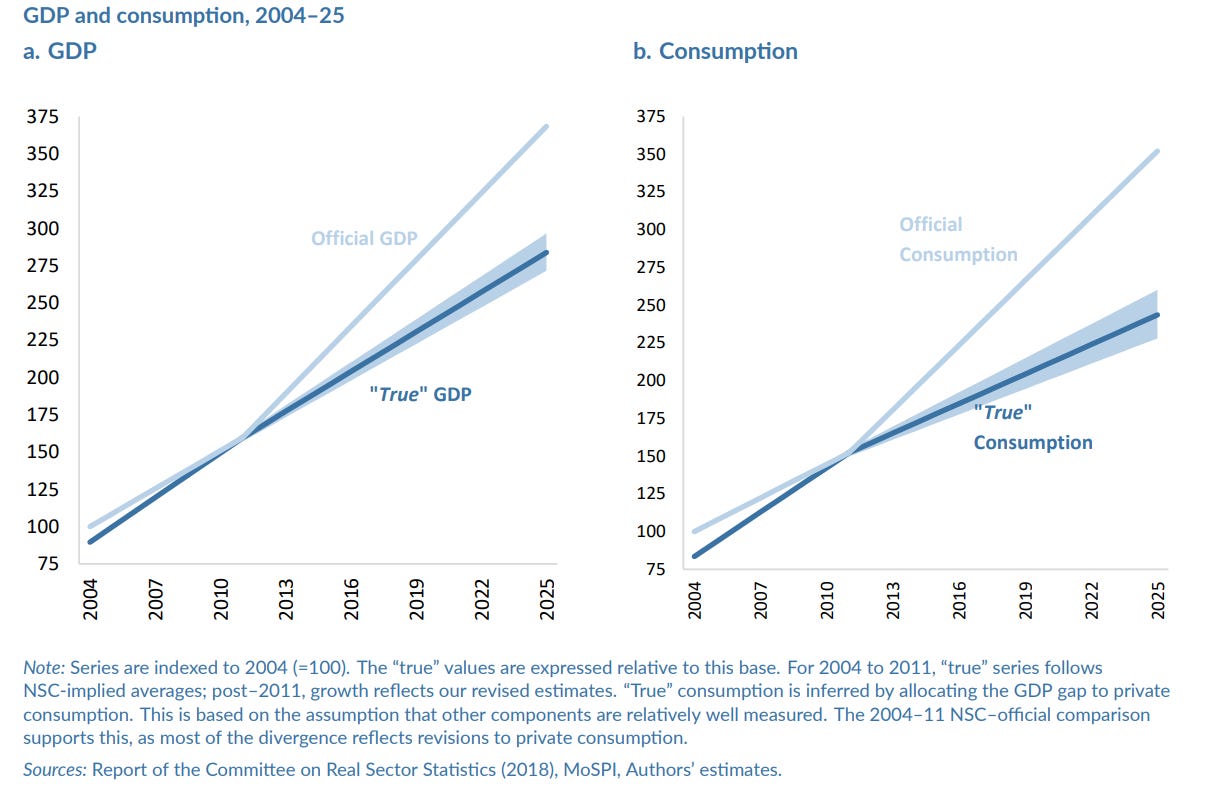
The paper generated considerable debate among economists. Some agreed with its conclusions. Others challenged its assumptions, methodology and interpretation. But regardless of where one stood, the discussion served an important purpose.
It shifted attention away from political arguments and back toward the quality of statistical measurement itself. Because ultimately, debates over GDP are rarely debates about arithmetic. They are debates about how best to observe an economy that cannot be observed directly.
What is India doing about it?
The answer is: quite a lot.
An economy is not something that can be measured once and forgotten. As industries evolve, technology changes, and new business models emerge, the statistical machinery must evolve alongside them. Otherwise, policymakers end up using yesterday’s instruments to understand today’s economy.
Imagine driving a modern electric car with a dashboard designed for a vehicle from the 1990s. The speedometer might still work, but it would tell you nothing about battery health, regenerative braking, software performance or charging efficiency. The car has changed; the dashboard must change too.
India’s economy is undergoing a similar transformation.
In little over a decade, the country has witnessed the rapid formalisation of businesses through GST, the explosion of digital payments, the rise of platform-based work, the expansion of services, and an increasingly data-driven economy. Measuring this new India using statistical methods designed around the economy of 2011 would inevitably leave important gaps.
Recognising this, the Ministry of Statistics and Programme Implementation (MoSPI) launched one of the most significant overhauls of India’s statistical system in February 2026. Rather than making isolated tweaks, the objective was to modernise the architecture itself—to ensure that official statistics reflect how India’s economy actually functions today.
A New Base Year for a New Economy
The most visible reform was the shift in the national accounts base year from 2011–12 to 2022–23.
At first glance, changing a base year sounds like the kind of announcement only statisticians would celebrate.
In reality, it matters enormously.
A base year acts as the reference point for measuring prices, production patterns and the relative importance of different sectors in the economy. But economies do not stand still.
Back in 2011, UPI did not exist. India’s startup ecosystem was far smaller. Digital commerce was in its infancy. Artificial intelligence was largely confined to research laboratories. The platform economy had barely begun reshaping employment.
Fast forward to today, and these sectors have become meaningful contributors to economic activity. Updating the base year therefore does not magically make the economy larger or smaller. Instead, it updates the statistical lens through which the economy is observed.
Much like replacing an outdated prescription with a new pair of glasses, the world itself does not change but you see it much more clearly.
Making Manufacturing Data More Realistic
One of the most important methodological improvements addressed an issue we discussed earlier: double deflation.
For years, economists had pointed out that manufacturing output could become distorted when rising raw material prices were treated in the same way as changes in the prices of finished products.
Consider a furniture manufacturer. Suppose timber prices double because of a supply shock, while the selling price of furniture rises only modestly. If statisticians use a single price adjustment, part of the increase in input costs may mistakenly appear as higher production.
The factory has not become more productive. Wood has simply become more expensive. Double deflation solves this problem by treating the two sides separately.
Instead of applying one common price index, statisticians independently adjust the value of output and the cost of intermediate inputs before calculating real value added.
The result is a cleaner estimate of genuine manufacturing growth one that reflects changes in production rather than fluctuations in commodity prices.
It is a technical refinement, but one with meaningful consequences. After all, better measurement leads to better diagnosis, and better diagnosis usually leads to better policy.
Finally Measuring the Largest Part of India’s Economy Every Month
Perhaps the most exciting reform, however, lies outside manufacturing altogether.
For decades, India has published the Index of Industrial Production (IIP) every month, allowing policymakers and investors to track the health of factories, mining and electricity generation.
But there was an obvious asymmetry. India is no longer primarily an industrial economy. Services account for well over half of the country’s Gross Value Added, yet policymakers had no equivalent high-frequency indicator to monitor them.
To bridge this gap, MoSPI introduced the experimental Index of Services Production (ISP) in July 2026, using 2024–25 as its base year.
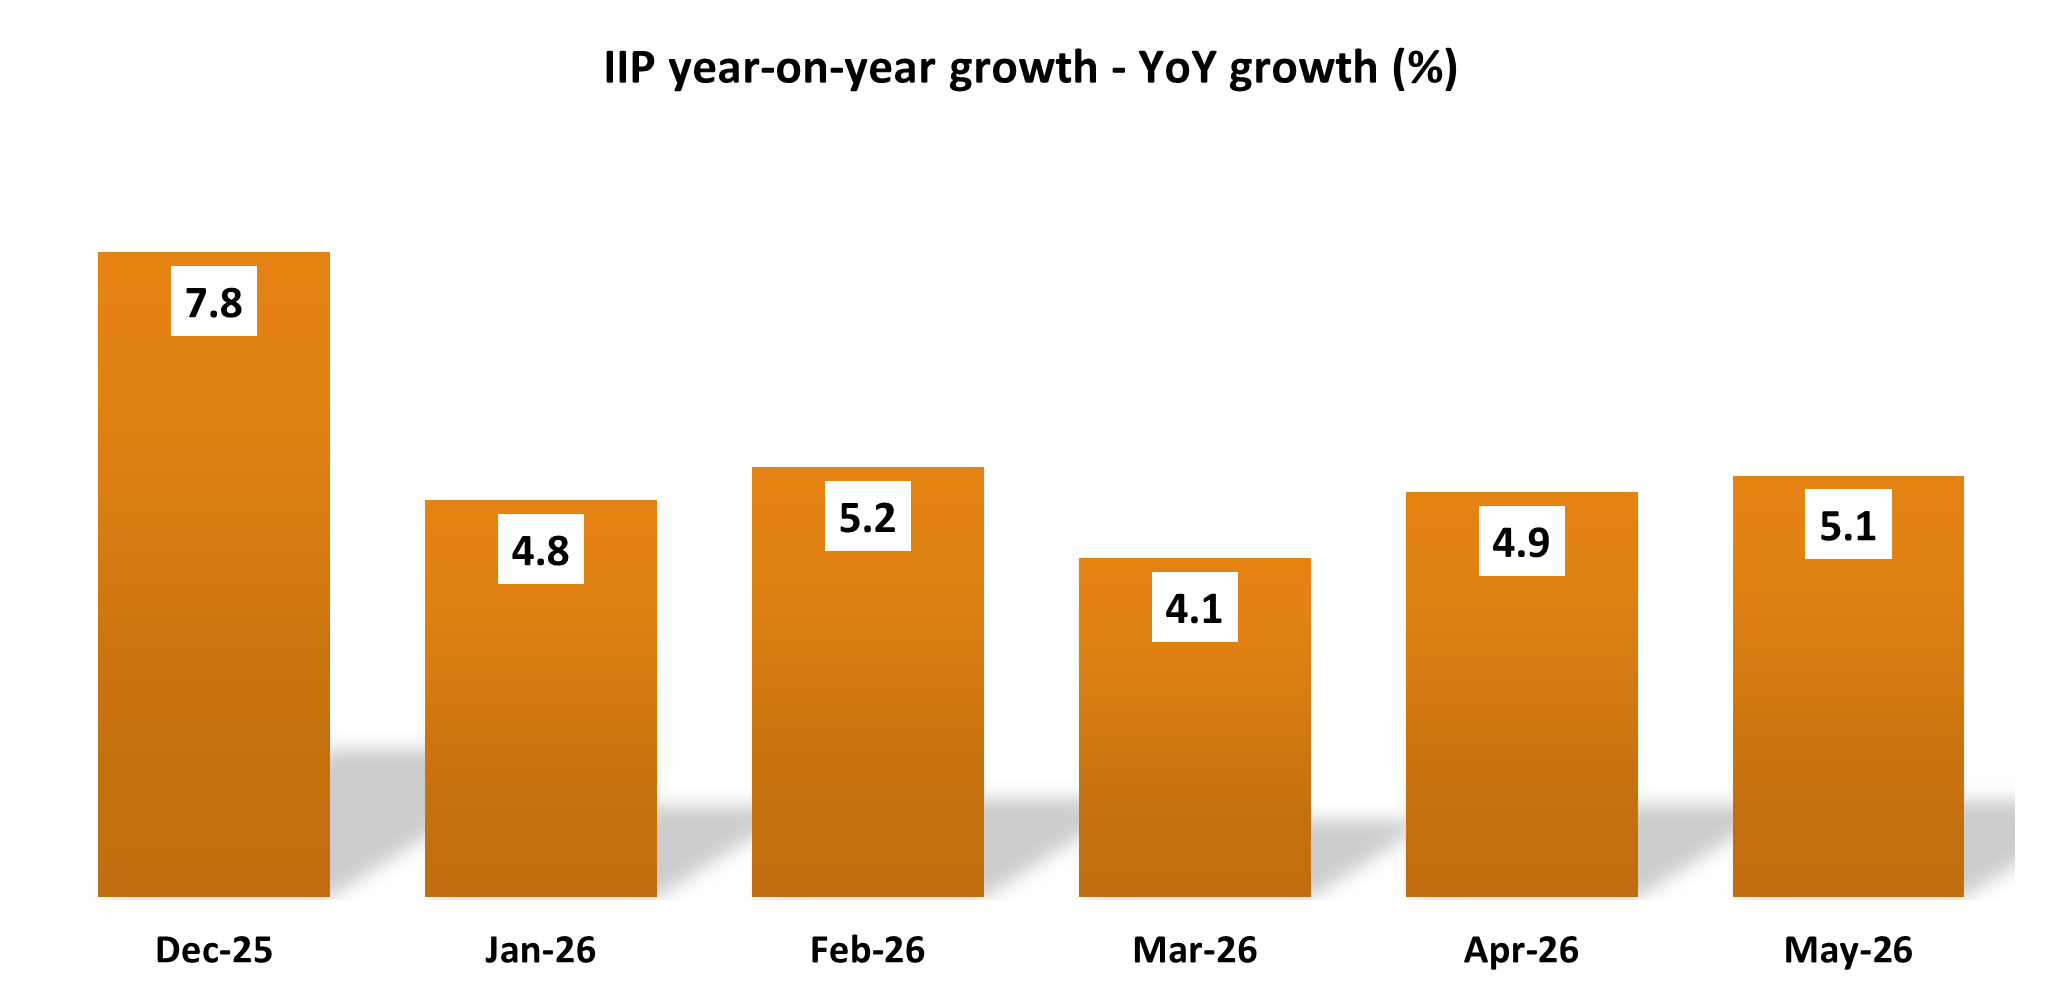
The significance of the ISP extends beyond another statistical publication.
Instead of relying mainly on delayed surveys, the index draws upon real-time administrative information, including GST outward supply data, enabling policymakers to observe developments in India’s service economy with much greater frequency.
For an economy increasingly driven by software firms, logistics companies, financial services, healthcare providers, education platforms, hospitality and digital businesses, this represents a major improvement.
Bringing India’s Informal Economy Into Sharper Focus
Another longstanding challenge in Indian national accounts has been measuring the informal sector.
Millions of businesses operate without detailed audited financial statements. Small retailers, self-employed professionals, household enterprises and countless micro-businesses collectively contribute a substantial share of India’s output, yet much of their activity cannot be directly observed through conventional administrative records.
Historically, statisticians often relied on historical benchmarks and proxy indicators to estimate this segment of the economy.
Those methods were practical. They were also increasingly dated.
The new 2022–23 series attempts to improve this by integrating richer datasets from the Annual Survey of Unincorporated Sector Enterprises (ASUSE) and the Periodic Labour Force Survey (PLFS).
These surveys provide more direct information on employment, production and income generated within India’s vast informal economy.
No statistical system will ever observe every street vendor, neighbourhood workshop or freelance worker in real time. But better surveys reduce the amount of educated guesswork required.
And in statistics, replacing assumptions with evidence is almost always progress.
Conclusion: The Economy We Measure Is the Economy We Govern
GDP is often treated as the final answer. In reality, it is the beginning of a conversation.
Every GDP estimate is an attempt to describe an economy that is constantly changing faster than the statistics designed to measure it. As India formalises, digitises, and increasingly creates value through ideas rather than objects, the challenge is no longer just growing the economy, it is ensuring that our statistical lens evolves just as quickly.
That is why the IMF’s reassessment matters. Not because an international institution gets to certify India’s growth story, but because it reminds us of something economists sometimes forget: before we argue about economic performance, we must first agree on how to measure it.
The irony is almost philosophical. We obsess over whether GDP grows by 6.5% or 6.8%, while quietly assuming that the ruler itself never needs recalibration. But every ruler ages. Every map becomes outdated. Every measuring system eventually struggles to describe a changing world.
And perhaps that leaves us with questions that are far more interesting than whether next quarter’s GDP surprises analysts.
Can twentieth-century statistics fully measure a twenty-first-century economy? And if measuring the economy increasingly shapes how we govern it, who should decide what is worth measuring in the first place?
Because sometimes, the most important number is not the GDP itself. It is the confidence we have in the way it is measured.
Sources- IdeasforIndia, PIB, MOSPI, PIB, IMF, economix, BusinessStandard, piie.