Here at EquityEdge Research, we make Small-Cap Investing easy for you by Backing you up with Robust & Full-Fledged Research.
We Have Launched Our Website. Please check
Please Fill the form Below if you are interested in our Services and would like a Free Sample of our Equity Research Report covering a Small/Micro-cap Company.
Read our Previous Report here:

Table of Contents:
Key Highlights.
Company Price Chart Analysis.
About the Company.
Management Analysis.
Financial Analysis
Ratio Analysis.
Shareholding Analysis.
Concall Analysis.
SWOT Analysis.
Competitors.
Premium (Includes Free):
Global BPO Industry.
Indian BPO Industry.
Financial Analysis- Quarterly.
Competitive Analysis- Bio & Financials.
Daily Share price trend TTM- Peer comparison.
Segment Wise Performance.
1. Key Highlights:
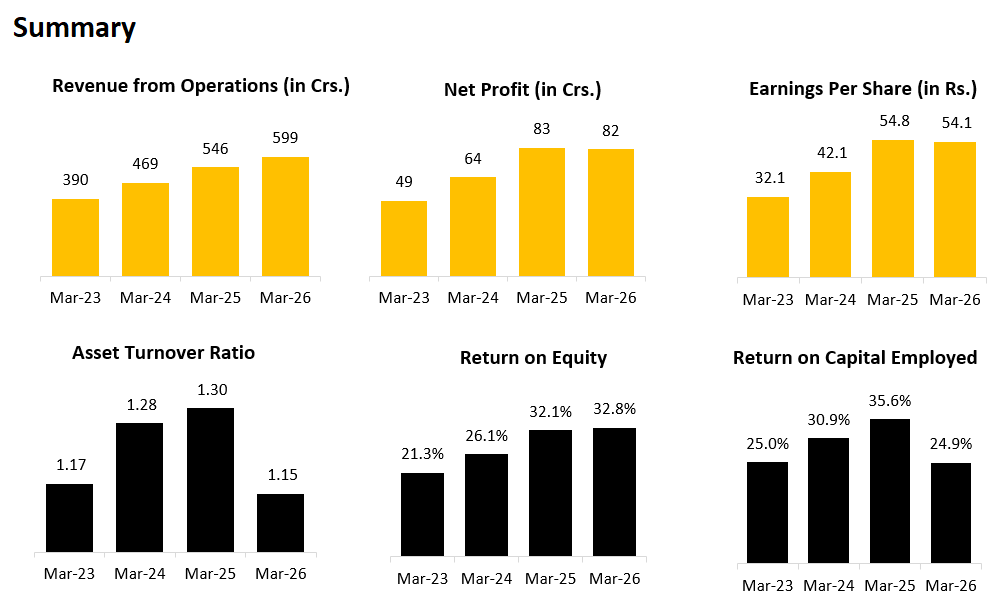
FY26
REVENUE: ₹ 599 Cr. (+9.71% YoY)
EBITDA: ₹ 162 Cr. (+24.62% YoY)
EBITDA MARGIN: 27% (+300 bps YoY)
PAT: ₹ 82 Cr. (-1.2% YoY)
Q4FY26
REVENUE: ₹ 155 Cr. (+1.31% QoQ, +6.16% YoY)
EBITDA: ₹ 44 Cr. (-4.35% QoQ, +25.71% YoY)
EBITDA MARGIN: 28% (-200 bps QoQ, +400 in YoY)
PAT: ₹ 29 Cr. (+38.1% QoQ, +52.63% YoY)
OTHER HIGHLIGHTS:
Growth composition: ~90% of employee-record growth came from new customers; existing-customer volumes “more or less plateaued.”
International mix: Management is pushing international higher; order book disclosure: “about 48% of my order book is on the international side” (T&D). International HRO margins “typically tend to be slightly higher.”
Efficiency target: SP4 deployment expected to drive ~INR3 Cr per annum efficiency in Tech & Digital.
Capex & depreciation outlook: CFO guided Chennai office build ~INR20 Cr; typical annual admin/facilities capex INR20–25 Cr. Depreciation expected to rise modestly; when pressed, CFO indicated next year depreciation likely sub-10% to ~10–15% higher than FY’26 (FY’26 depreciation referenced as ~INR58.6 Cr).
Margin trajectory appears structurally supported (operating leverage, higher international mix, low-margin domestic BPM exit), with management reiterating ~1%–1.5% (up to 2%) YoY margin improvement intent, while expecting BPM margins to hold ~13–14% and T&D to remain strong.
2. Company Price Chart Analysis:
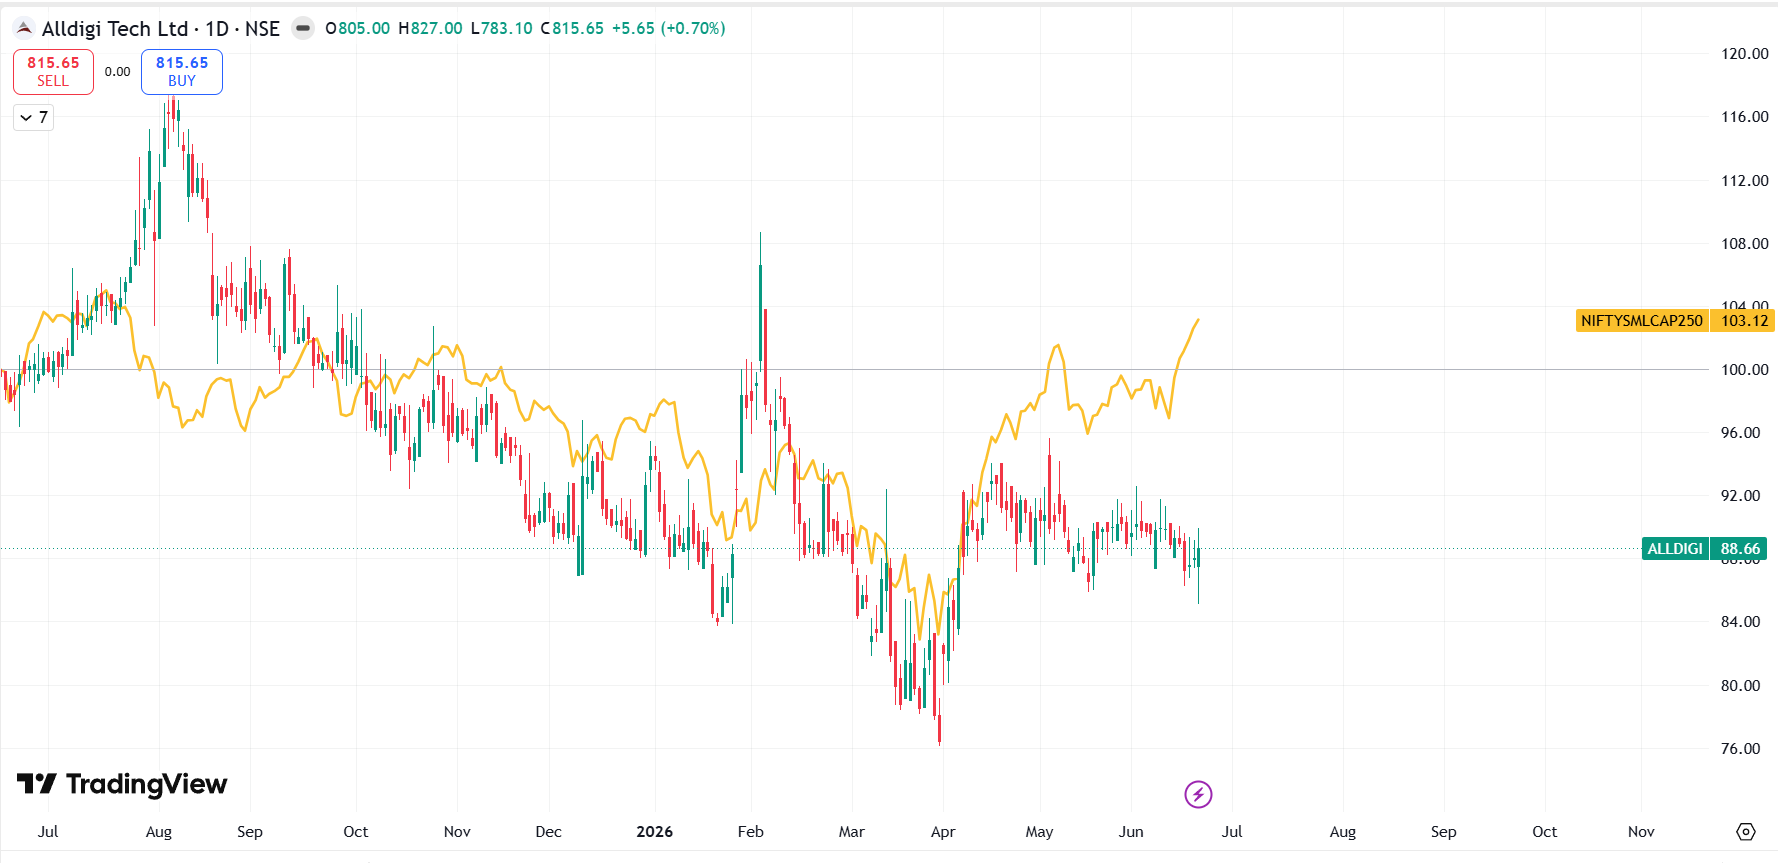
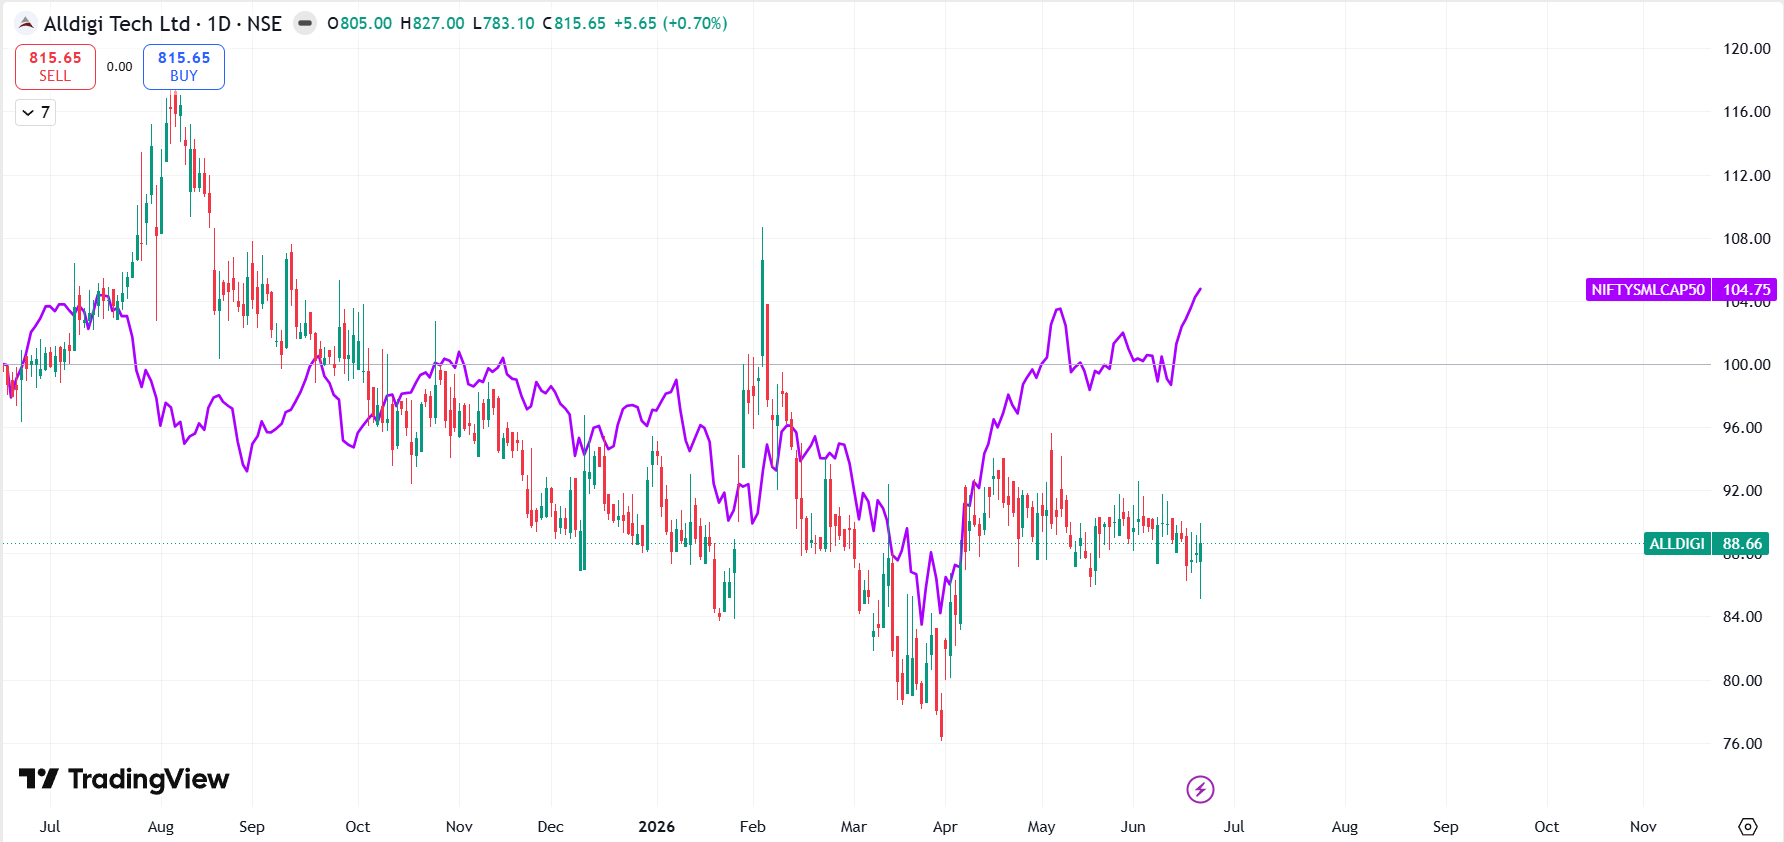
*Comparison charts are Indexed*
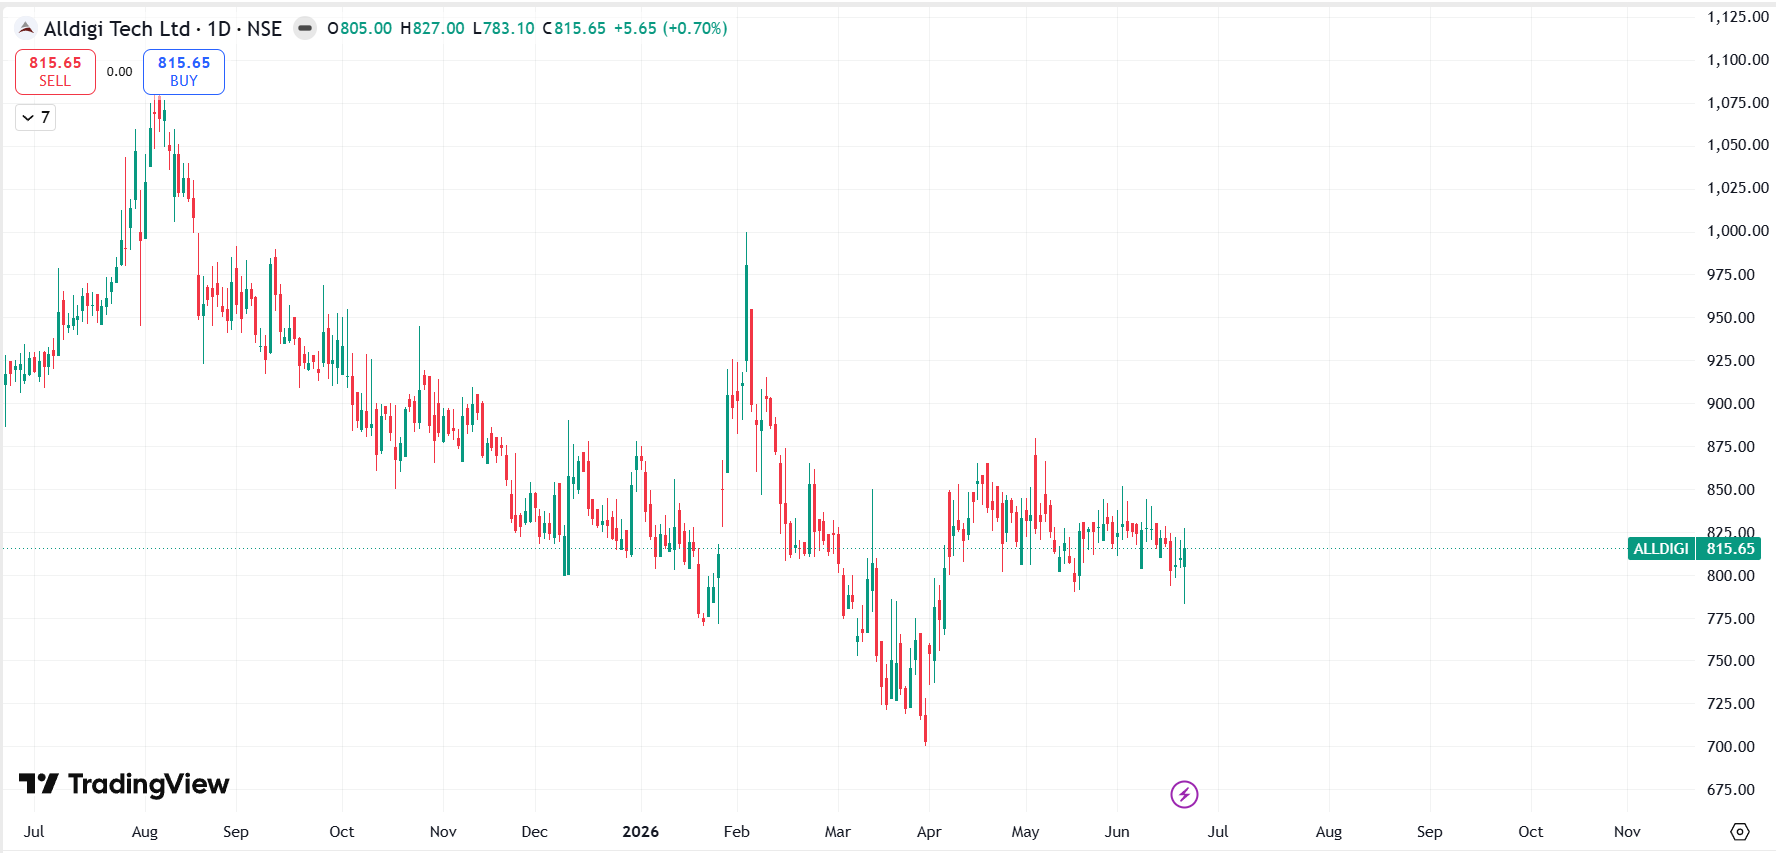
2.1 Alldigi Tech Ltd. Performance:
2.2 Alldigi Tech Ltd. Vs. NFTYSMLCAP250:
2.3 Alldigi Tech Ltd. Vs. NFTYSMLCAP50:
3. About Company:
Alldigi Tech Ltd. (formerly Allsec Technologies Ltd.) is a global Business Process Management (BPM) and Digital Transformation services company. The company provides a wide range of outsourced business services including customer experience management, payroll processing, HR outsourcing, finance & accounting services, compliance management, KYC/AML operations, healthcare support, and digital technology solutions. It serves clients across banking, fintech, retail, e-commerce, healthcare, insurance, and other sectors in more than 60 countries.
In FY25/FY26, the company updated its segment nomenclature from Customer Experience Management (CXM) and Employee Experience Management (EXM) to Business Process Management (BPM) and Technology & Digital (T&D) respectively, reflecting the evolving nature of its service offerings.
3.1 BUSINESS SEGMENTS:
1. Business Process Management (BPM):
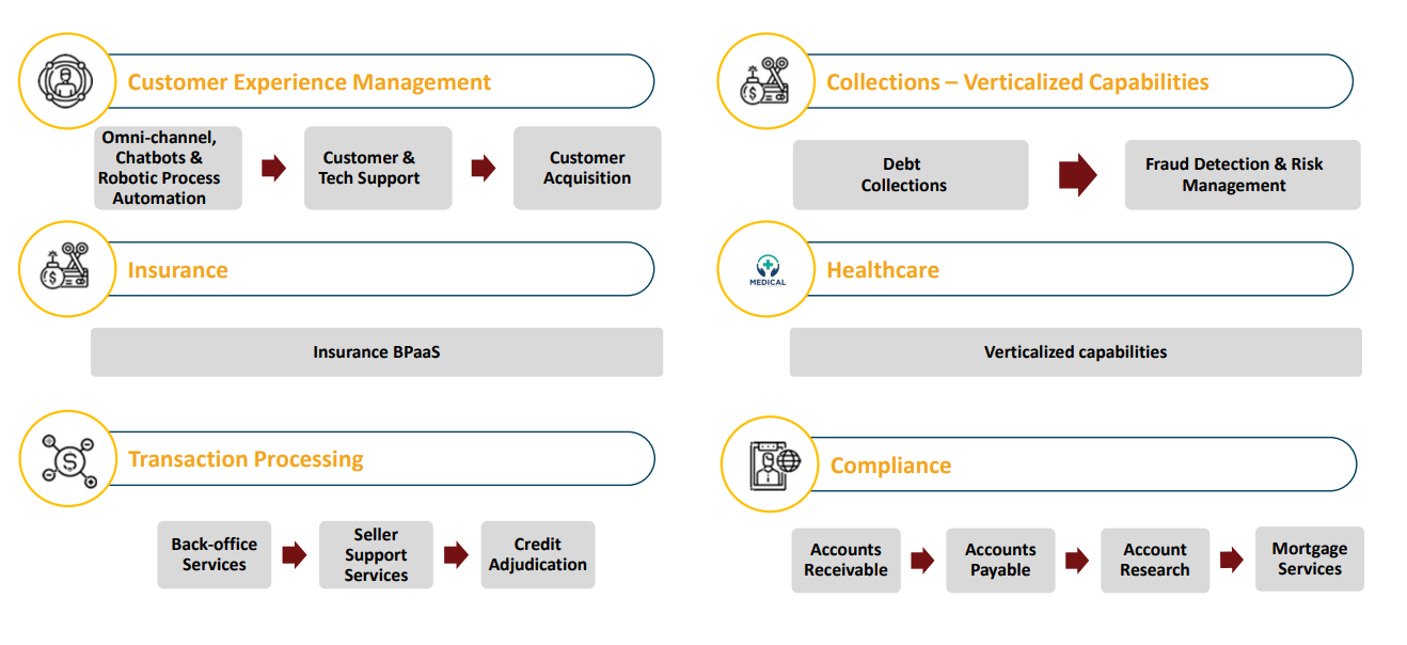
This is the largest business segment of the company and comprises a broad range of outsourced operational services that help enterprises improve efficiency, customer engagement, and compliance. The segment includes:
Customer support (voice and non-voice)
Collections and recovery services
Finance & accounting outsourcing
Healthcare process management
Insurance operations
AML/KYC verification services
Mortgage and title support services
HR and statutory compliance services
The BPM segment helps clients reduce operating costs, improve service quality, and focus on their core business activities. Following the FY25 reclassification, HR statutory compliance services were also moved into this segment.
2. Technology & Digital (T&D):
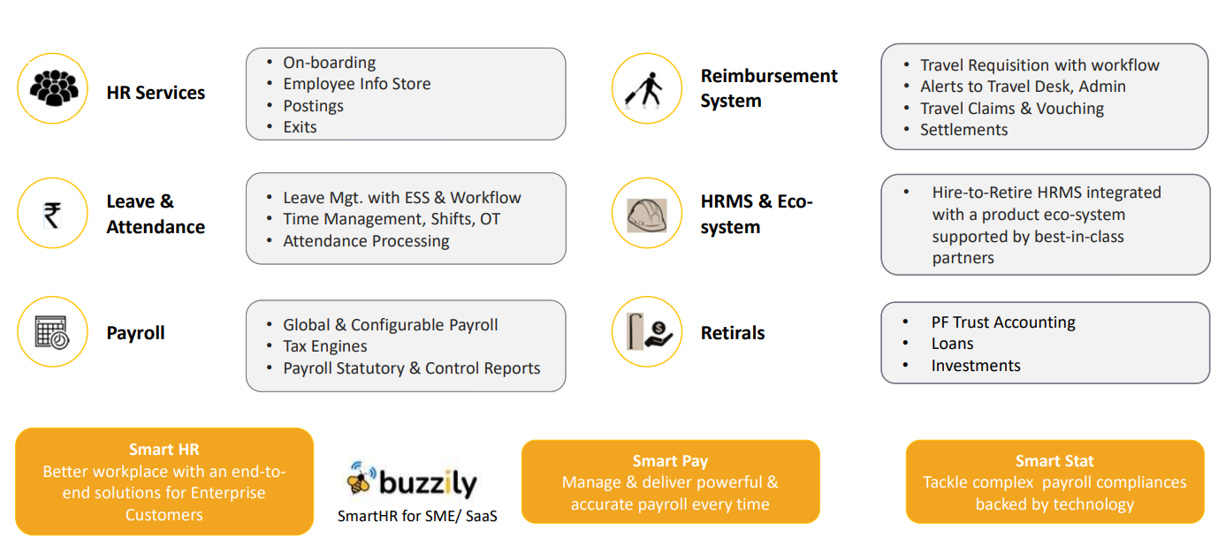
The Technology & Digital segment focuses on employee experience, payroll, HR technology, and digital transformation solutions. The segment provides technology-enabled services that help organizations manage workforce operations and improve employee engagement.
Key offerings include:
Multi-country payroll processing
HR outsourcing solutions
Workforce administration
Employee lifecycle management
Digital HR platforms
Automation and analytics solutions
The company processes large volumes of payroll and HR transactions for enterprises across multiple geographies, making this segment a key driver of recurring revenue.
3.2 T&D(Payroll) Services
3.3 BPM
3.4 Global Footprint
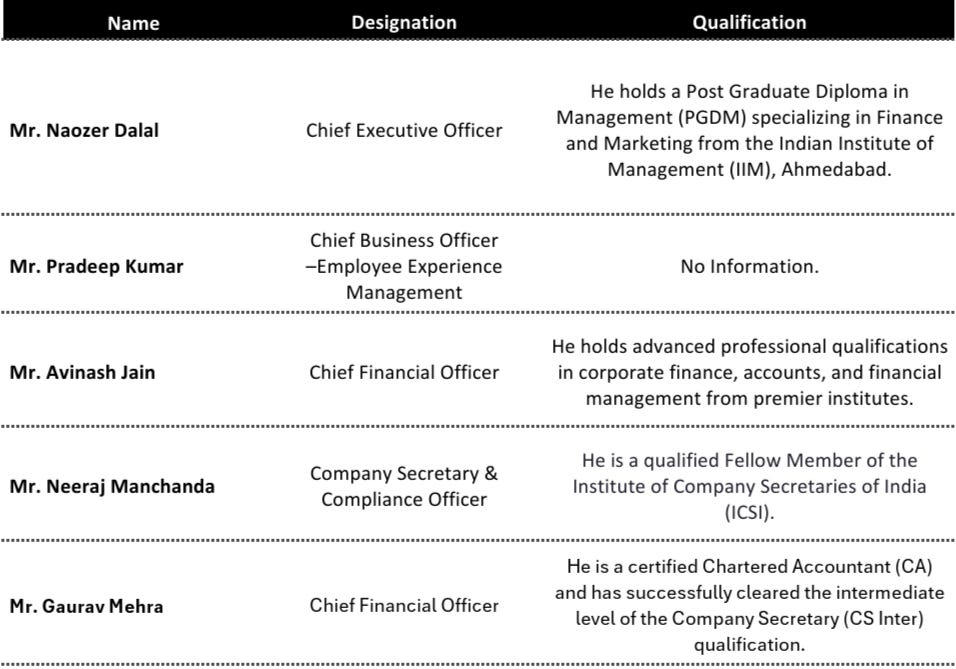
4. Management Overview:
4.1 KMP’s Remuneration:

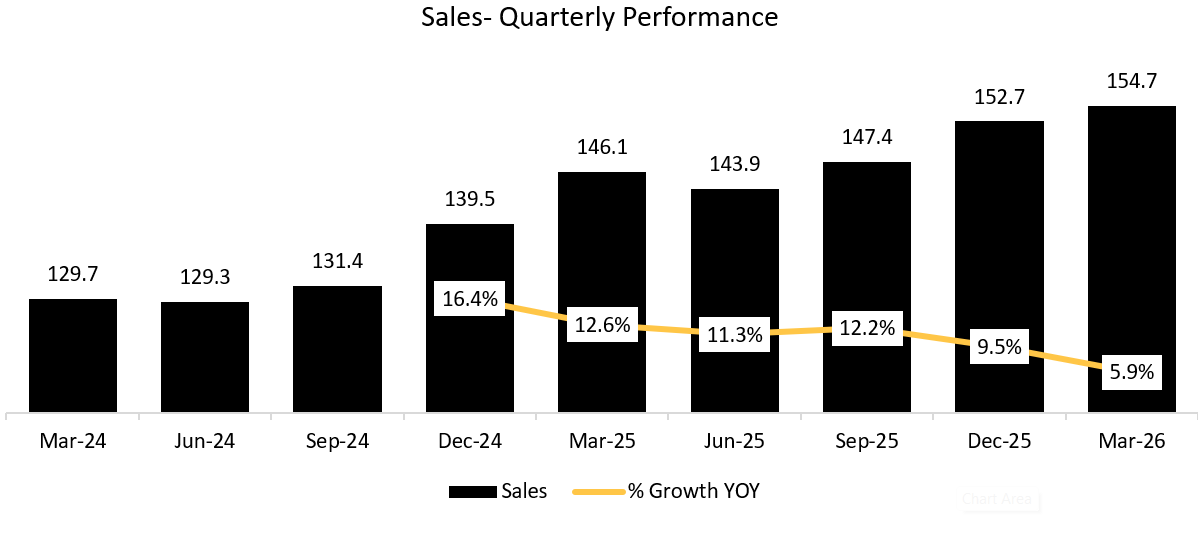
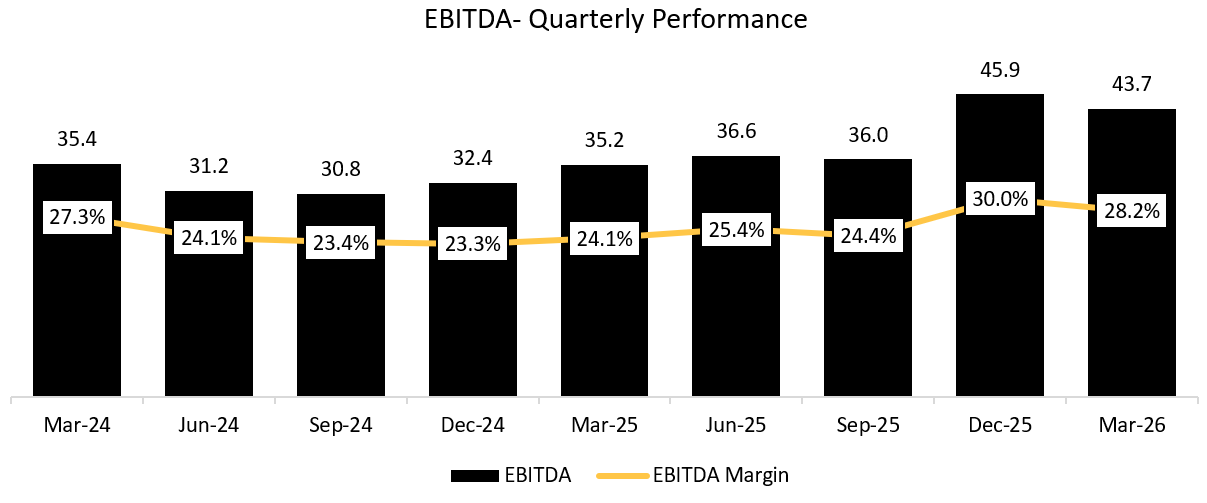
5.1 QUARTERLY ANALYSIS:
(Read detailed Quarterly Analysis in the Premium Version)
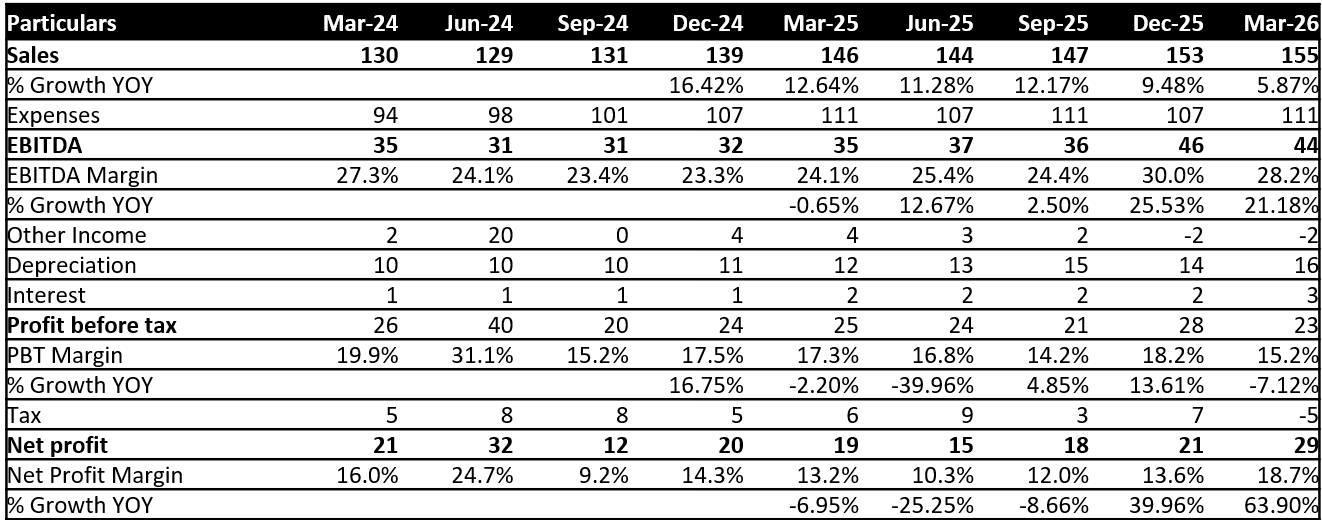
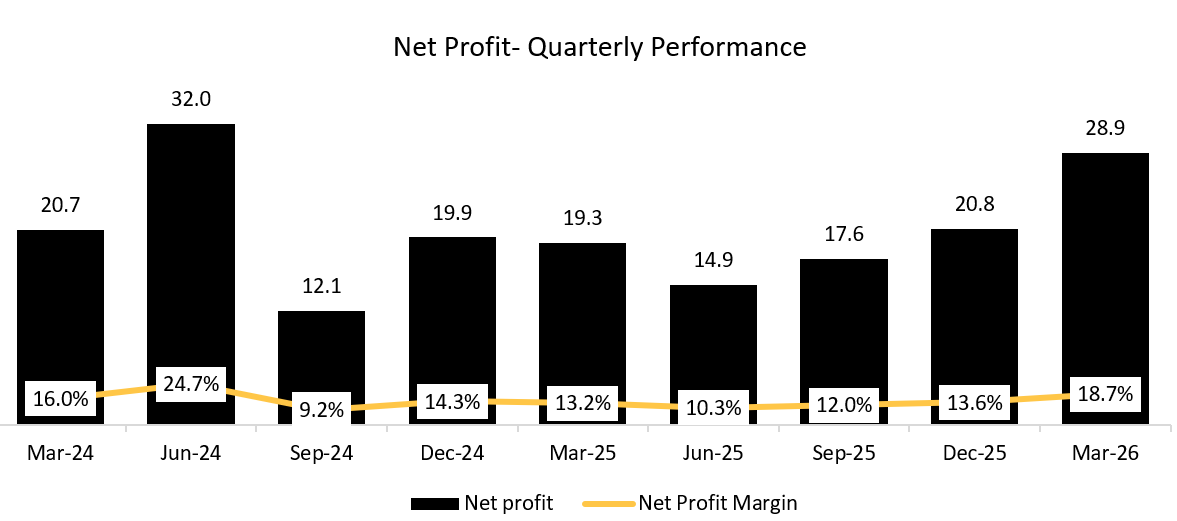
Growing at a CGR of 2.2% in last 9 Quarters.
Growing at a CGR of 2.7% in last 9 Quarters.
Growing at a CGR of 4.2% in last 9 Quarters.
5.2 ANNUAL ANALYSIS:
(Read detailed Annual Analysis and Forecasts in the Premium Version)
5.2.1 Revenue:
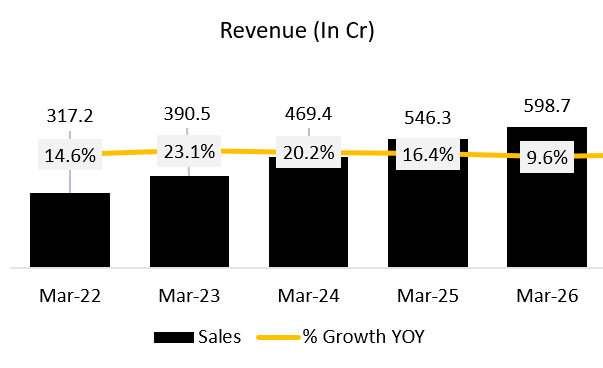
4Y CAGR: 17.2%
Sales growth slowing to double digit in FY25 and single digit in FY26
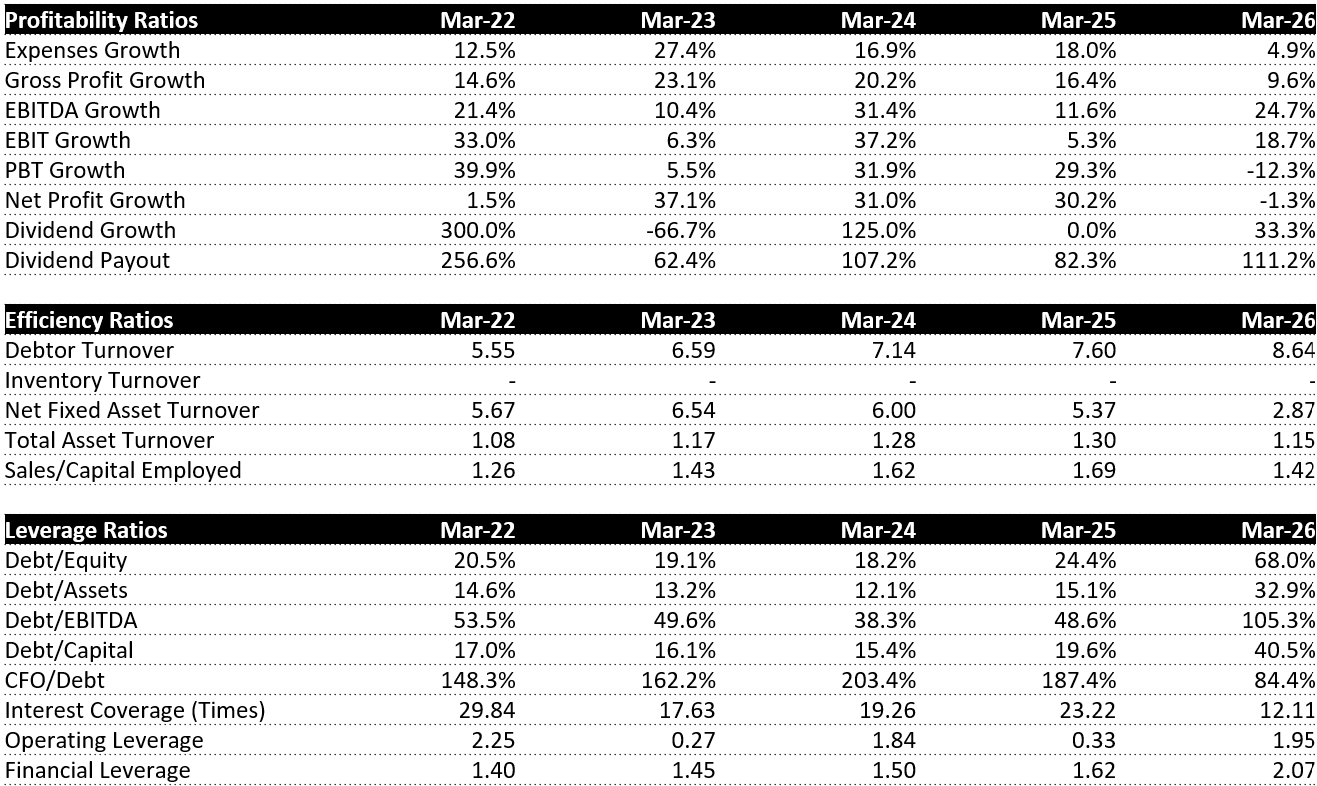
The deceleration from 20.2% in FY24 to 16.4% in FY25 to 9.6% in FY26 reflects a deliberate strategic shift rather than a demand problem. Management has been actively exiting low margin domestic BPM business, about 10% of the BPM portfolio, in favour of higher margin international work, and this rationalisation weighed directly on the topline. BPM growth for FY26 came in at just 7.3%, while T&D grew much faster at 16.5%, showing the slowdown is concentrated in BPM.
The other factor is the absence of a large new BPM logo. BPM revenue grows in steps tied to large client wins rather than gradually, and the last major one was a healthcare client onboarded 18 to 24 months prior. No comparable win has landed since, partly due to macro uncertainty causing some prospective large clients to pause decisions. Of the FY26 growth itself, management quantified that 3.3% came from currency depreciation and only 6.3% from underlying operational effort, meaning the organic growth engine slowed even more than the headline number suggests.
5.2.2 EBITDA:
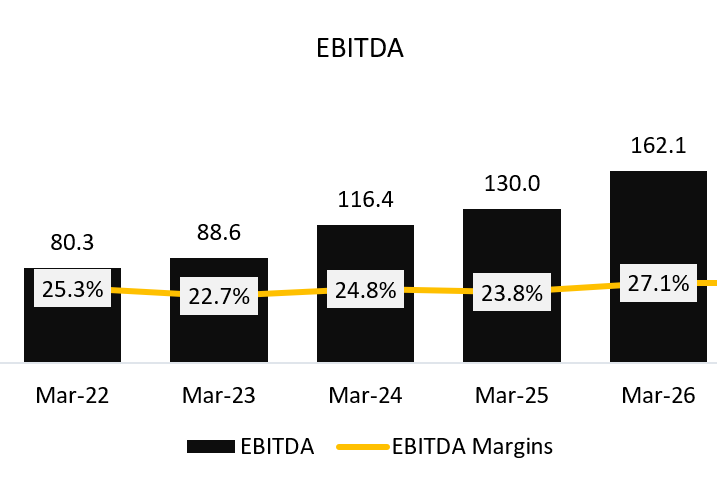
4Y CAGR: 19.2%
EBITDA margin spike in FY26
EBITDA margin jumped from 23.8% in FY25 to 27.1% in FY26, the sharpest annual improvement in this set. Three genuine drivers explain this. First, international mix rose from 64% to 67% at the overall company level, with BPM international mix reaching 78% (up from 73%) and T&D also tilting more international, both of which carry better realisation. Second, currency depreciation contributed directly to margin, separate from its revenue effect. Third, operating leverage and early AI driven efficiency gains, including the SP4 platform consolidation, reduced cost intensity as scale built up.
It is worth noting one quarter within FY26 (Q3) carried a onetime leave policy reversal that inflated that specific quarter, but the full year number is large enough that this one off does not materially distort the FY26 annual margin story, the improvement is broadly structural.
5.2.3 Net Profit:
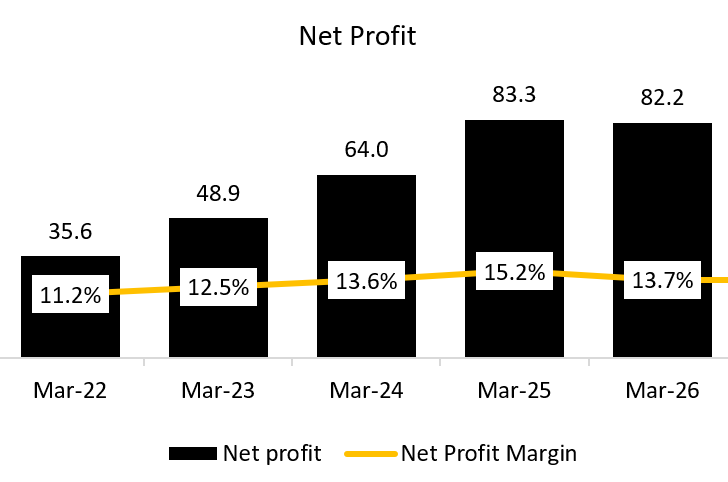
4Y CAGR: 23.2%
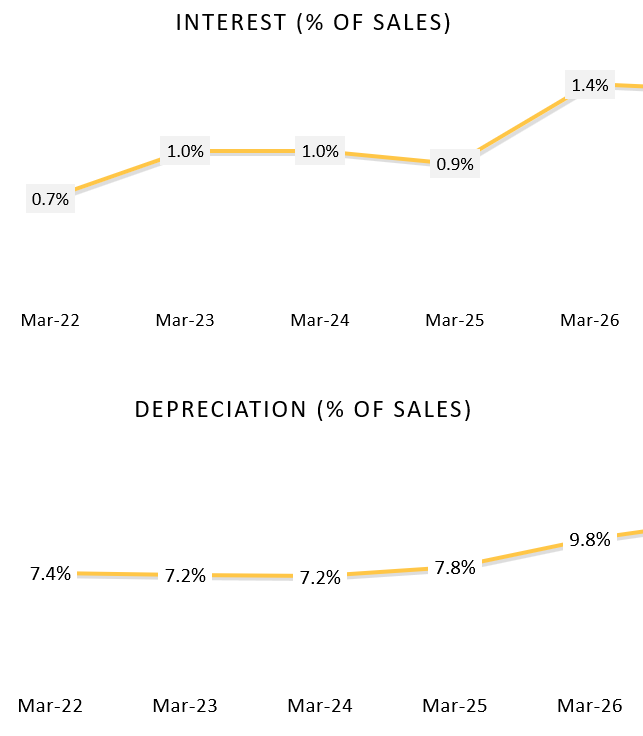
PAT margin spike in FY25 and reversion in FY26
FY25’s PAT margin of 15.2% was inflated by a one off, the divestment of the Aparajitha compliance business, which added a profit on sale that flowed through other income (5.1% of sales, sharply higher than the 1.5% to 2.1% range in surrounding years). PBT margin that year touched 20%, the highest in the set, largely because of this gain rather than core operating improvement.
FY26 PAT margin normalised to 13.7%, even though EBITDA margin actually improved meaningfully. This happened because other income collapsed back to 0.3% of sales with no comparable one off, while depreciation jumped sharply from ₹43 crore to ₹59 crore on continued facility investments in Bangalore and Manila, and interest cost also rose from ₹5 crore to ₹9 crore. So FY25 was the aberration driven by a divestment gain, and FY26 is closer to the genuine run rate, with EBITDA strength being partly absorbed by higher depreciation and finance costs below the line.
5.2.4 Balance Sheet:
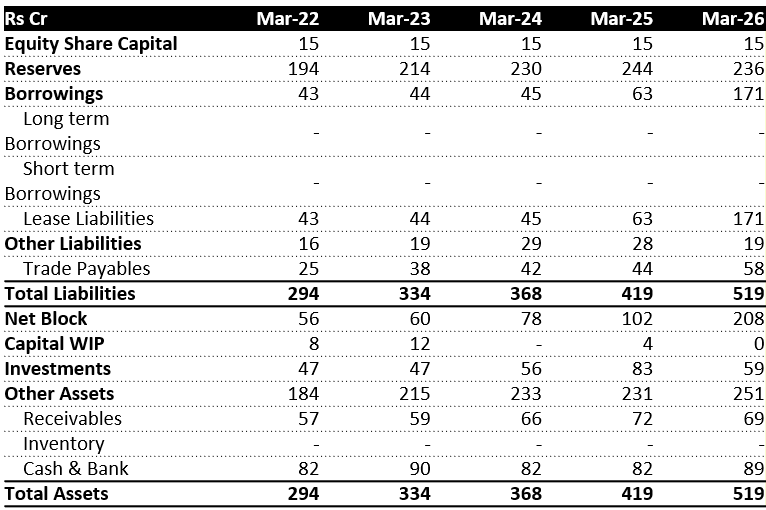
Why borrowings have been increasing so much?
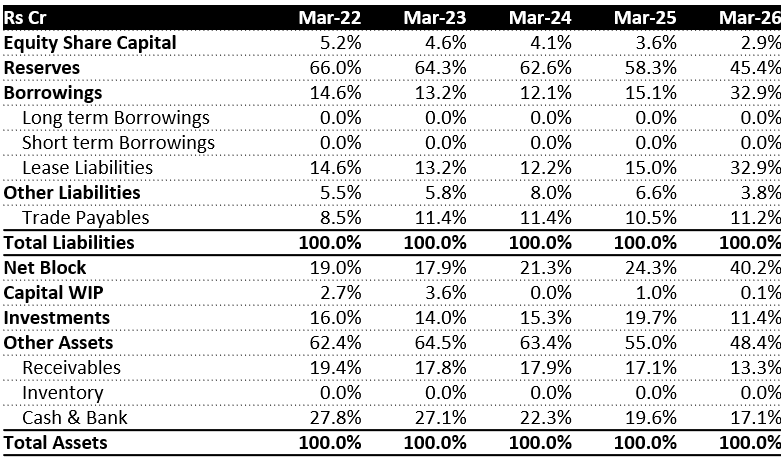
The entire borrowings line is lease liabilities, there is no long term or short term debt at all, both show zero throughout. So this is not financial leverage, it is accounting for office space taken on rent. Borrowings moved from ₹43 crore in FY22 to ₹63 crore in FY25, a gradual rise, then jumped sharply to ₹171 crore in FY26, taking the share of total liabilities from 15.1% to 32.9% in a single year.
This ties directly to the facility consolidation management has discussed across calls. The Bangalore facilities were consolidated at a new location (SS Plaza), and this is the investment year reflected here. Under Ind AS, when a company takes a large new office on a long term lease, the present value of all future lease payments gets recognised upfront as a lease liability, even though no cash borrowing has happened. The bigger and longer the lease commitment, the larger this liability appears immediately.
Why net block has increased so much for an asset light BPO company?
Net block grew steadily from ₹56 crore in FY22 to ₹102 crore in FY25, then jumped to ₹208 crore in FY26, with its share of total assets nearly doubling from 24.3% to 40.2% in that one year.
This is the direct counterpart to the lease liability story above. Under Ind AS 116, when a company signs a lease, it does not just record a liability, it also creates a matching right of use asset on the asset side, which sits inside net block. So the Bangalore consolidation, along with the broader Manila seat scale up (from around 600 seats to close to 2,000 over recent years) and ongoing infra upgrades, is inflating both sides of the balance sheet together. This also explains the steadily rising depreciation seen each year, since the right of use asset gets depreciated over the lease term just like owned property would.
So, the company remains structurally asset light in terms of owned property, plant, and equipment, what shows up here is the accounting capitalisation of operating leases. FY26 specifically marks the year the Bangalore consolidation and related facility investments landed, which is why both lines jump together that year rather than rising gradually as in prior years.
5.2.5 Common-Size Balance Sheet:
5.2.6 Cash Flow Analysis:
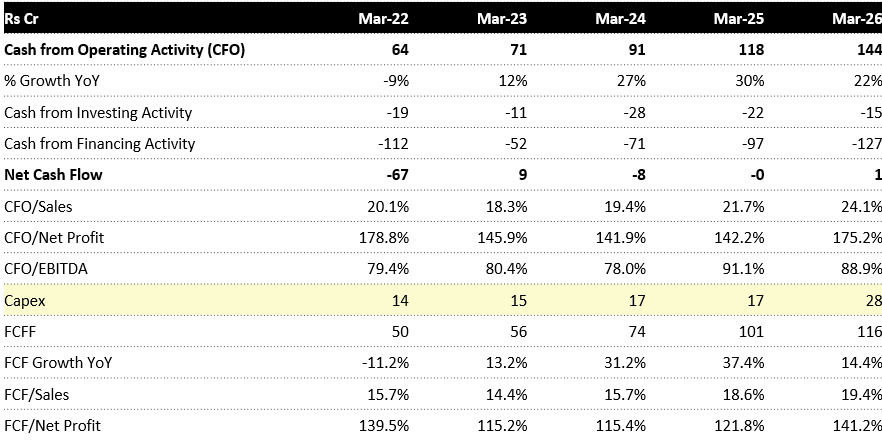
CFO continuously rising over the last 5 years
Cash from operating activity has moved from ₹70 crore in FY21 to ₹144 crore in FY26, a steady climb each year alongside profit from operations rising from ₹72 crore to ₹158 crore over the same period. The core driver is simply that the underlying business has scaled, revenue and EBITDA have grown every year through this period, and that flows straight into operating cash generation.
Working capital has stayed broadly disciplined rather than draining cash. Receivables actually turned favourable in FY26, releasing ₹5 crore versus consuming cash in most prior years, and payables contributed a healthy ₹13 crore. This matches what management has repeatedly emphasised on calls, that collections remain robust and OCF to EBITDA conversion is tracked closely as a key metric, conversion in FY26 works out to roughly 89% (144 against 158), broadly consistent with the strong conversion levels flagged in past quarters.
CFI staying continuously negative
Investing outflow has been negative in nearly every year shown, but the composition of that outflow has shifted meaningfully. Fixed assets purchased has grown steadily, from single digits a decade ago to ₹28 crore in FY26, directly reflecting the facility investments discussed earlier, Bangalore consolidation, Manila scale up, and the upcoming Chennai and Noida upgrades.
The bigger swing item is investments purchased and sold, which looks more like treasury management than core capex. FY25 and FY26 show large investments purchased (₹64 crore and ₹83 crore) alongside large investments sold (₹43 crore and ₹112 crore), meaning surplus cash is being parked in and rotated out of investment instruments rather than sitting idle. Net CFI has actually narrowed to negative ₹15 crore in FY26 from negative ₹22 crore in FY25, despite higher fixed asset spend, because investment sales more than offset that.
CFF becoming increasingly negative
Financing outflow has widened sharply, from negative ₹19 crore in FY21 to negative ₹127 crore in FY26. This is overwhelmingly a dividend story. Dividends paid have risen from ₹18 crore in FY21 to ₹91 crore in FY26, by far the largest single line in this section every year, consistent with management’s stated intent to maintain a consistent, predictable dividend policy.
The other growing piece is financial liabilities, which has gone from ₹13 crore in FY21 to ₹28 crore in FY26. This connects directly to the lease liability discussion, as right of use assets get capitalised, the corresponding lease payments flow through here as repayment of the lease obligation, and this naturally grows as the company takes on larger leased facilities. So the widening CFF is a combination of a generous and growing dividend payout plus rising lease repayment obligations tied to the facility expansion, not any distress or borrowing related cash strain, since proceeds from and repayment of actual borrowings remain at zero or negligible throughout.
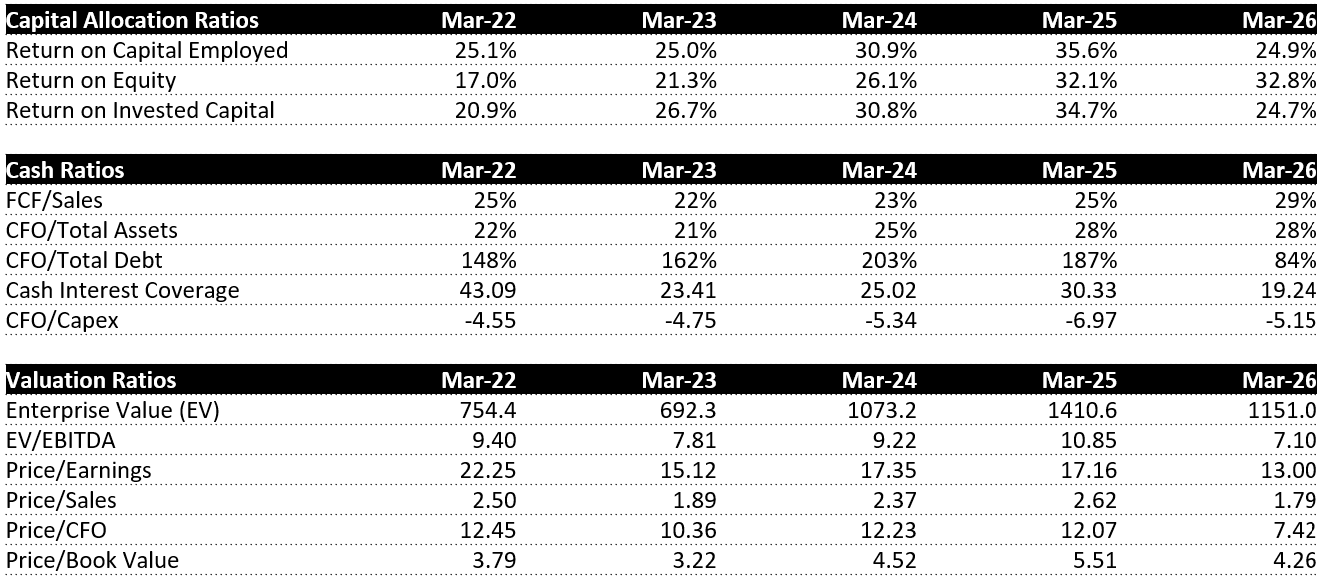
6. Key Ratios:
7. Shareholding Pattern:
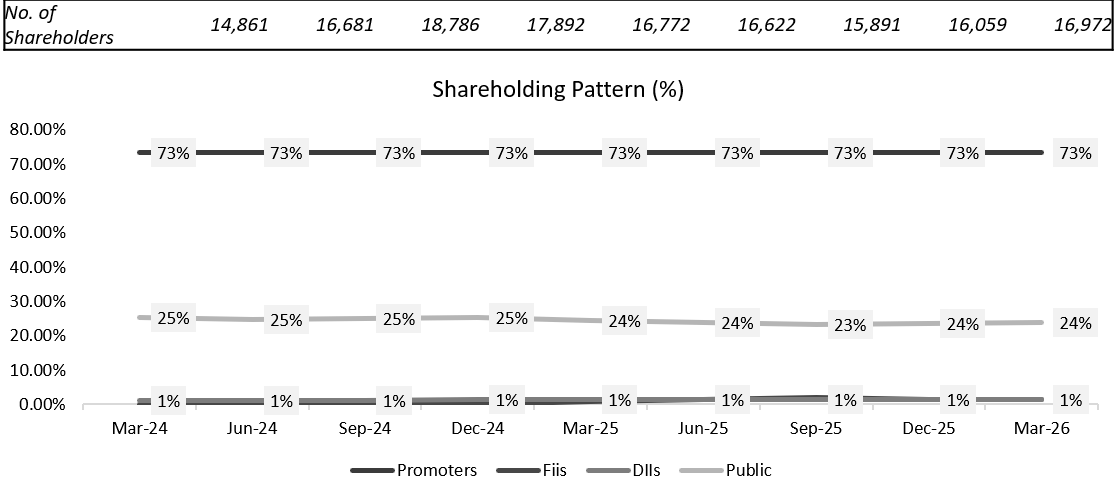
8. Con-call Analysis (Q4 FY26):
1. Performance Overview: Broad-Based Growth and Operating Leverage
Pivotal Growth Year: FY26 was marked by transition under newly appointed CEO, Mr. Natarajan Laxsmanan (”Nat”). The company made strategic decisions to focus on international, high-margin business, transitioning away from select low-margin domestic operations.
Segment Contributions: Both verticals performed steadily, with the international business increasing its overall revenue share by 3% to reach 67% (up from 64% in FY25).
2. Strategic Initiatives & Growth Levers
The company is executing a clear strategic intent to increase its technology enablement, transition to higher-margin business, and enhance global compatibility.
Rationalization of BPO/BPM Portfolio:
Management has initiated a strategic headcount rationalization in the domestic BPM business to transition away from low-margin domestic contracts. Low-margin operations now represent only about 10% of the overall portfolio.
Platform Migration and Platform Upgrades:
Successfully completed the migration of India-based customers to the SP4 platform, which is projected to generate recurring efficiency gains of INR 3 crores per annum within the Tech & Digital segment.
The company is releasing “HRMS Version 2” this year an integrated, AI-enabled console merging payroll and HRMS platforms to reduce manual data reconciliation for customers.
Infusion of AI and Advanced Analytics:
Launched PulseHR.ai, an internally focused AI tool designed to automate channel inputs and reduce manual intervention in service delivery.
Developing AI-based payroll analytical modules to offer customers actionable business insights, opening extra monetization channels beyond per-employee-per-month (PEPM) fees.
Targeted BPM Verticals:
Positioning the BPM business around three core segments for FY27: Healthcare and Revenue Cycle Management (RCM), International Insurance, and International Collections.
The RCM sub-segment has already doubled in capacity (FTE count) over the last quarter.
3. Capacity & Future Targets
Managed Employee Records (T&D):
Processed 49.9 lakh employee records in Q4, reaching a total of 191.5 lakh records for the full year FY26.
Added INR 40.1 crores of new Annual Contract Value (ACV) through new client acquisition and existing expansions.
BPM Segment Performance:
Added INR 54.1 crores of new ACV in FY26.
International business now contributes 78% of total Customer Experience Management (CXM/BPM) revenues, up from 73% in the prior fiscal year.
Future Growth and Diversity:
Management is guiding for mid-teen revenue growth for FY27.
Diversity and inclusion metrics improved by 1.2% to 47.9% in FY26, with a target to reach 50% in the near term.
4. Margin Analysis & Cost Headwinds
Segment Margin Outperformance:
BPM Segment: Reported Q4 margins at 13.6%. The temporary QoQ margin compression was driven by a one-off leave policy alignment with the holding company (which has since been resolved). Normal margin levels remain within the 11% to 14% range.
Tech & Digital (T&D): Segment margin reached approximately 44% in Q4 (FY26 full-year T&D segment margin stood at INR 66.6 crores, growing 28.9% YoY).
Margin Guidance: Management targets a consistent annual margin expansion of 1% to 1.5% going forward, supported by currency depreciation benefits and technological efficiencies.
5. Working Capital, Cash Flows & Capex
Outstanding Cash Generation:
Year-end cash position was healthy at INR 147.7 crores.
Full-year cash collections rose 9% YoY to INR 626.1 crores.
OCF stood at INR 45.3 crores in Q4 (103.8% OCF-to-EBITDA conversion) and INR 144.1 crores for the full year (88.9% conversion).
Office Infrastructure & Capex Outlook:
Upgrading key facilities in Chennai and Noida. The new Chennai office construction involves an investment of approximately INR 20 crores.
Routine administrative and facility capex is expected to remain consistent in the range of INR 20–25 crores per annum.
Depreciation stands at approximately INR 58.6 crores, with next year’s depreciation run rate expected to grow within a sub-10% to 15% range.
6. Key Q&A Insights
Right to Win in HRO: Management highlighted that Allsec’s proprietary HRO platform is highly customizable and flexible compared to rigid global platform competitors. This allows quick local configuration while maintaining robust API integration compatibility with global payroll frameworks.
Sales Conversion Hierarchy: Deals with fewer than 1,000 employees are typically closed at the HR department level. However, larger deals (5,000+ employees or multi-country operations) are negotiated and closed directly at the CFO/CHRO level (accounting for roughly 30% of total deals).
Order Book Metrics: Out of the outstanding order book for the HRO business, approximately 48% is represented by international contracts.
Inorganic Strategy: The company is actively evaluating potential strategic acquisitions on both the T&D and BPM sides of the business to support inorganic expansion.
9. SWOT ANALYSIS:
Strengths
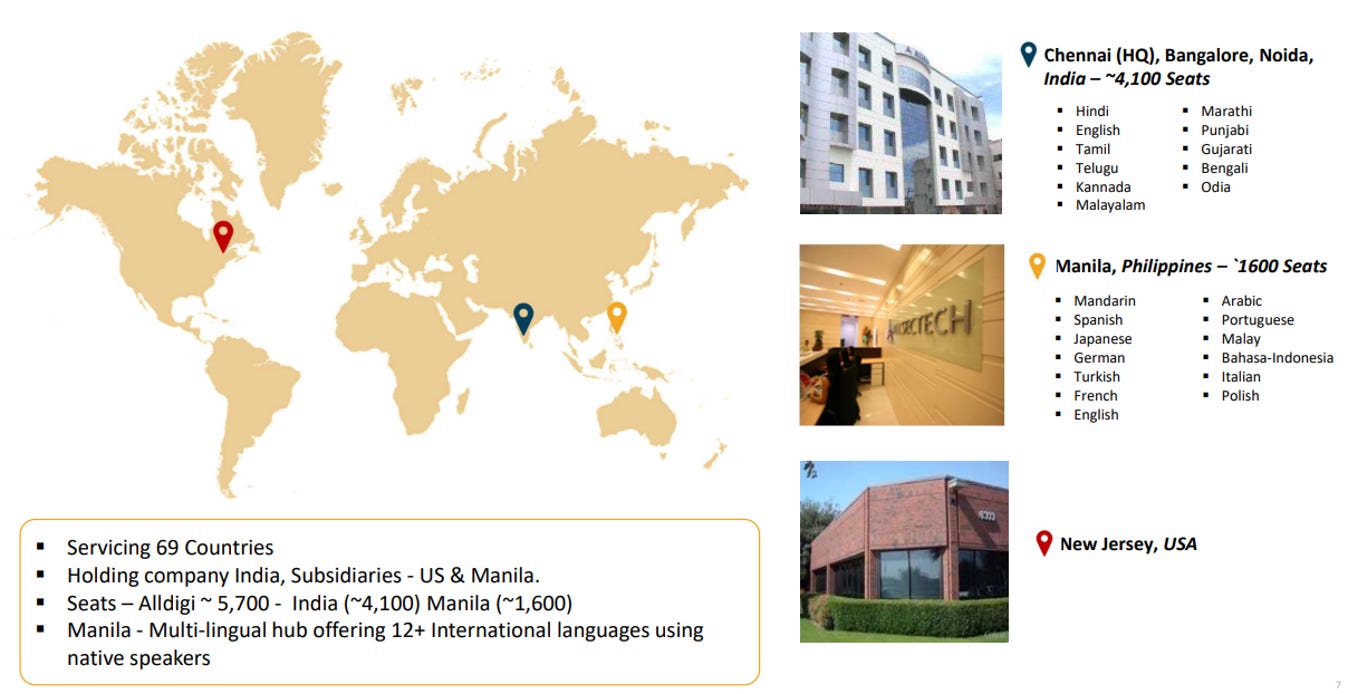
Global Delivery Network: Operates ~5,700 seats across India and the Philippines, enabling service delivery to clients in 69 countries.
High-Volume HRO Platform: Processes ~19.15 million payroll records annually, supported by a self-service portal with over 500,000 monthly user logins.
Strong Productivity Gains: Increased payroll records processed per FTE by 14.3% YoY while maintaining a stable payroll headcount of 689.
Long-Term Enterprise Relationships: Maintains highly sticky client relationships spanning 10–20 years, including large accounts with over 3.5 lakh employees processed monthly.
Weaknesses
Dependence on New Client Wins: Around 90% of recent payroll volume growth has come from new customers, as mature clients have largely reached headcount saturation.
Declining Domestic BPM Workforce: Exit from low-margin contracts led to a 14.2% YoY decline in BPM headcount, driven by a sharp reduction in domestic operations.
Delayed Software Rollouts: Core platform upgrades are being implemented in phases, with the Philippines migration lagging India by several months.
Legacy System Fragmentation: Historically separate HRMS and payroll platforms required manual reconciliation and slowed configuration changes.
Geographic Concentration: Delivery operations are concentrated in four cities, increasing exposure to local labor and infrastructure disruptions.
Opportunities
AI-Led Process Automation: PulseHR.ai aims to automate input consolidation and reduce manual interventions across payroll workflows.
Integrated HRMS Platform Rollout: The phased deployment of HRMS Version 2 will unify HRMS and payroll systems and support multi-country opportunities.
Healthcare and RCM Expansion: The rapidly scaling RCM business provides an entry into higher-value healthcare back-office services.
Shift Toward International BPM: Increasing international business mix allows replacement of lower-margin domestic volumes with higher-yield portfolios.
Geography-Focused Sales Structure: Specialized regional sales teams can help expand the international HRO business beyond its current scale.
Threats
Generative AI Disintermediation: Clients may increasingly automate payroll and query management internally, reducing outsourcing volumes.
Longer Deal Cycles: Macroeconomic uncertainty and geopolitical disruptions can delay outsourcing decisions and pipeline conversion.
Talent Competition in Manila: Intense competition for multilingual talent may increase costs and affect delivery stability.
Pricing Pressure from Larger Players: Global competitors with scale advantages can offer aggressive pricing, pressuring margins.
Legacy Domestic Business Drag: The remaining low-margin domestic BPM contracts continue to consume management bandwidth and resources.
10. Competitors:
10.1 One Point One Solutions Ltd.:
Market Cap: ₹ 1,525 Cr.
One Point One Solutions Ltd., headquartered in Mumbai, Maharashtra, operates in the Business Process Management (BPM) and Customer Experience Management Industry. The company provides customer lifecycle management, business process outsourcing (BPO), digital transformation, and back-office support services to clients across banking, financial services, telecom, healthcare, e-commerce, and other industries.
Business Model:
One Point One Solutions operates a service-based BPM and outsourcing model, helping enterprises manage customer interactions and business processes.
The company provides customer support, collections, tele-sales, technical support, verification, and back-office processing services.
Revenue is generated through long-term contracts with corporate clients across multiple sectors.
The company leverages technology, analytics, automation, and AI-driven solutions to improve operational efficiency.
It benefits from the growing trend of businesses outsourcing non-core operations.
What Sets Them Apart:
Diversified Client Base: Serves BFSI, telecom, healthcare, e-commerce, and other sectors.
Technology-Driven Operations: Increasing use of automation, analytics, and digital solutions.
Scalable Business Model: Asset-light operations with the ability to expand capacity efficiently.
Long-Term Customer Relationships: Recurring revenue from established enterprise clients.
10.2 Hinduja Global Solutions Ltd.:

Market Cap: ₹ 1,989 Cr.
Hinduja Global Solutions Ltd., headquartered in Bengaluru, Karnataka, operates in the Business Process Management (BPM) and Digital Customer Experience Industry. The company provides customer experience management, digital transformation, back-office processing, and technology-enabled BPM services to clients across healthcare, telecom, media, retail, technology, and financial services sectors.
Boud-based services.
The company benefits from increasing demand for outsourced customer manusiness Model:
HGS operates a global BPM and digital services model, serving enterprises across multiple geographies.
The company provides customer support, technical support, digital customer engagement, automation, and back-office services.
Revenue is generated through long-term contracts with global corporate clients.
HGS also offers digital solutions, analytics, AI-enabled customer experience, and clagement and digital transformation services.
What Sets Them Apart:
Global Delivery Network: Operations across India, North America, Europe, and Asia-Pacific.
Strong Healthcare Presence: Significant exposure to the healthcare and insurance sectors.
Digital Transformation Capabilities: Focus on automation, analytics, AI, and cloud-based solutions.
Diversified Client Portfolio: Serves multiple industries and international customers.
10.3 RPSG Ventures Ltd.:
Market Cap: ₹ 2,853 Cr.
RPSG Ventures Ltd., headquartered in Kolkata, West Bengal, operates as a diversified consumer and technology-focused investment company. The company has interests across FMCG, retail, IT services, sports franchises, and emerging business ventures, primarily through its subsidiaries and strategic investments.
Business Model:
RPSG Ventures operates a diversified investment and business ownership model, focusing on high-growth consumer and technology sectors.
The company owns and manages businesses in:
FMCG and packaged foods.
Retail and lifestyle products.
IT and digital services.
Sports and entertainment ventures.
Revenue is generated through operating businesses, subsidiary performance, and strategic investments.
The company benefits from exposure to multiple growth sectors of the Indian economy.
What Sets Them Apart:
Diversified Portfolio: Presence across consumer, technology, retail, and sports businesses.
Strong Promoter Group: Backed by the RP-Sanjiv Goenka Group.
Multiple Growth Engines: Exposure to both traditional and new-age businesses.
Strategic Investment Approach: Focus on scaling high-potential businesses.
Thank You So Much For Reading!!
Researched By- Naresh, Mayank and Vaibhav
All information is sourced from the company’s annual reports, Press Release, News Articles, GoIndiastocks.in, Screener.in, industry reports, and Economy Outlook reports.
Disclaimer: We do not recommend buying or selling any stock. You should consult your financial advisor before buying or selling any financial instrument.
We are Proud to Announce Our New Launch of the Premium services where we Deep-dive into the Business and back you up with Robust Research.
We Provide services for different Level of Investors. You can Email us directly to start your journey!